If you are a scientist, you’ll likely need to create a scientific illustration or a graphical abstract at some point.
The truth is that there are plenty of situations in which including an illustration or a diagram can be really helpful to better communicate your science. Think about a research or review article, a scientific presentation, a poster, or a grant.
But, what software should you use?
In this post, we’ll review some of the best software for creating scientific illustrations and graphical abstracts.
Don’t worry, there is life beyond PowerPoint! And some options are even free!
Let’s find the software that works best for you!
Let’s start with one of the most popular option: Microsoft PowerPoint
PowerPoint is probably the most popular program among scientists, researchers and similar professionals.
It is commonly used to create scientific presentations. But If you give it a chance, it’s also a powerful tool for other communication materials such as scientific posters and papers figures.
In addition, PowerPoint has some interesting tools to create scientific illustrations and graphical abstracts.
Using this program, you can also make animations and videos, which are a great option to share your research through social media.
The main advantage of PowerPoint is that you have probably used it throughout your education, so you have already been trained in it. This program is intuitive and easy to use, and most people feel familiar with it.
How can we create scientific illustrations using PowerPoint?
Going to Insert -> Shapes, you’ll access to a panel with lots of basic shapes that can be combined and modified to create different elements.
With two shapes selected, you can go to Shape format->Merge Shapes and combine them in different ways. Thus, using basic shapes like squares and circles, you can create more elaborate elements like cell receptors and organelles.
In the same tab, with a shape selected, you can also select Edit Shape. This option allows you to alter the contour of the shape.

If you don’t feel like drawing, you can also play with the Icons tools.
In the Icon panel, you will find lots of categorized symbols to use on your scientific illustrations, graphical abstracts or any other work. You can also customize the icons by changing their colors to better adapt them to your color scheme.

PowerPoint also offers multiple options to create and modify graphs, and it can recognize vector files.
But with all these advantage, why you should even consider using other programs?
One major disadvantage is that despite PowerPoint has a lot of tools, its customizability is limited compared with other more professional programs like Adobe Illustrator.
In addition, PowerPoint is not free. Probably your institution have paid the license, so you can use it freely while you are at work. But you might need to pay for it if you also want to use it from home.
If you are a PowerPoint fan, Microsoft offers different subscriptions options, a free month trial and special offers for students.
Looking for something similar to PowerPoint, but free? Have you already tried Google Slides?
The free alternative to PowerPoint is Google Slides.
Despite its resources to create illustrations are more limited and less customizable than the ones found in PowerPoint; Google Slides has improved a lot over the years, and can be a suitable alternative for those who don’t want to pay.
With Google Slides, you can also insert basic shapes to create different elements for your illustrations.
In this case, the program doesn’t offer the possibility to combine the shapes to create new ones. But, alternatively, you can group more than one shape of the same color to create the illusion of one single object.

You can also insert different types of charts and diagrams, and drag and drop images from Google by searching for them directly on Google Slides. To do so, just click Insert-> Image-> Search the web. A new column with a search tool will appear on the right.

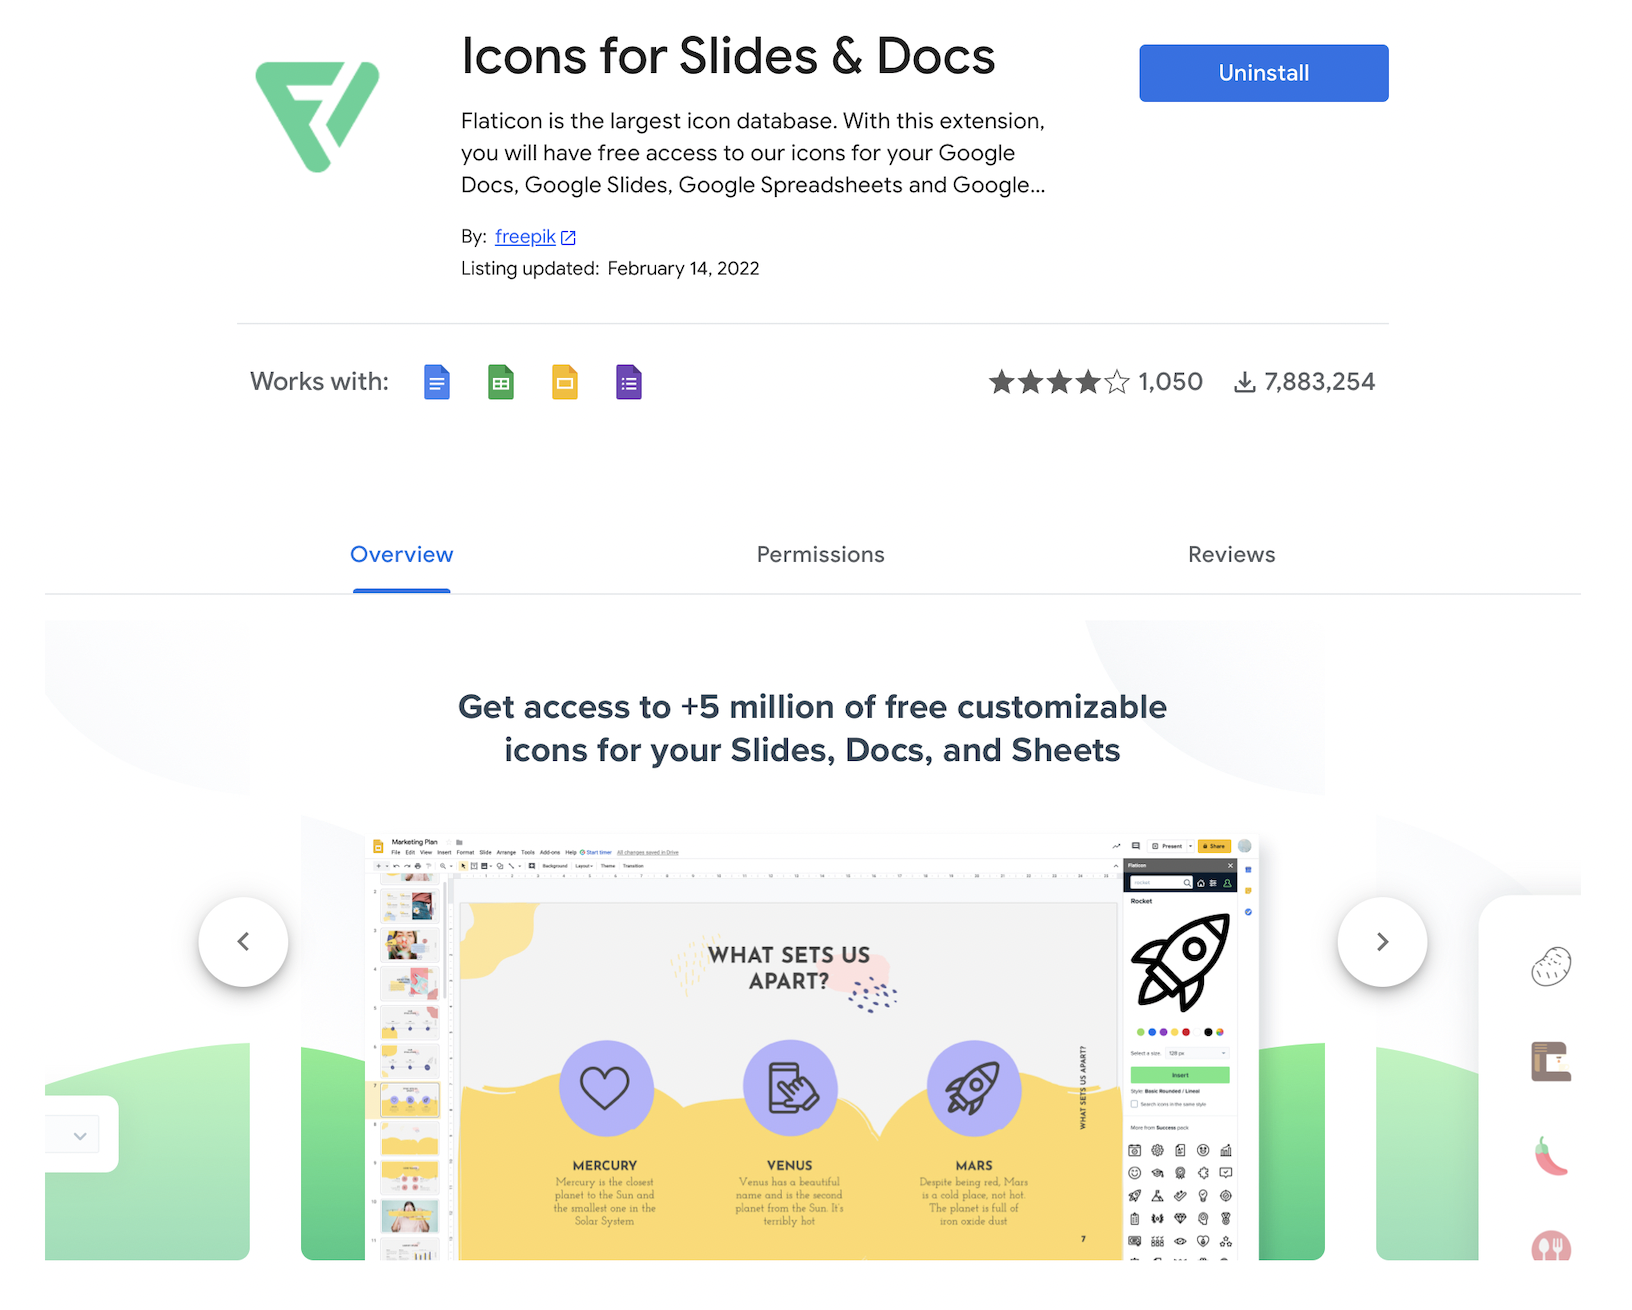
Despite it is more basic and limited compared to PowerPoint, you can install different complements to increase the capabilities of Google Slides. For instance, by installing Icons for Slides and Docs, you’ll have access to a large library of icons, including scientific elements like cells or DNA strands.
Another great advantage of Google Slides is that you can access your files wherever you are. So you don’t need to worry about carrying with you the last version of your illustration or to send it by e-mail every time. As a counterpart, you will need access to Internet to work with it.
Wait, are you a Mac user? Then, there is another alternative for you!
Keynotes is the best free alternative for PowerPoint if you have a Mac! These two programs are nearly identical.
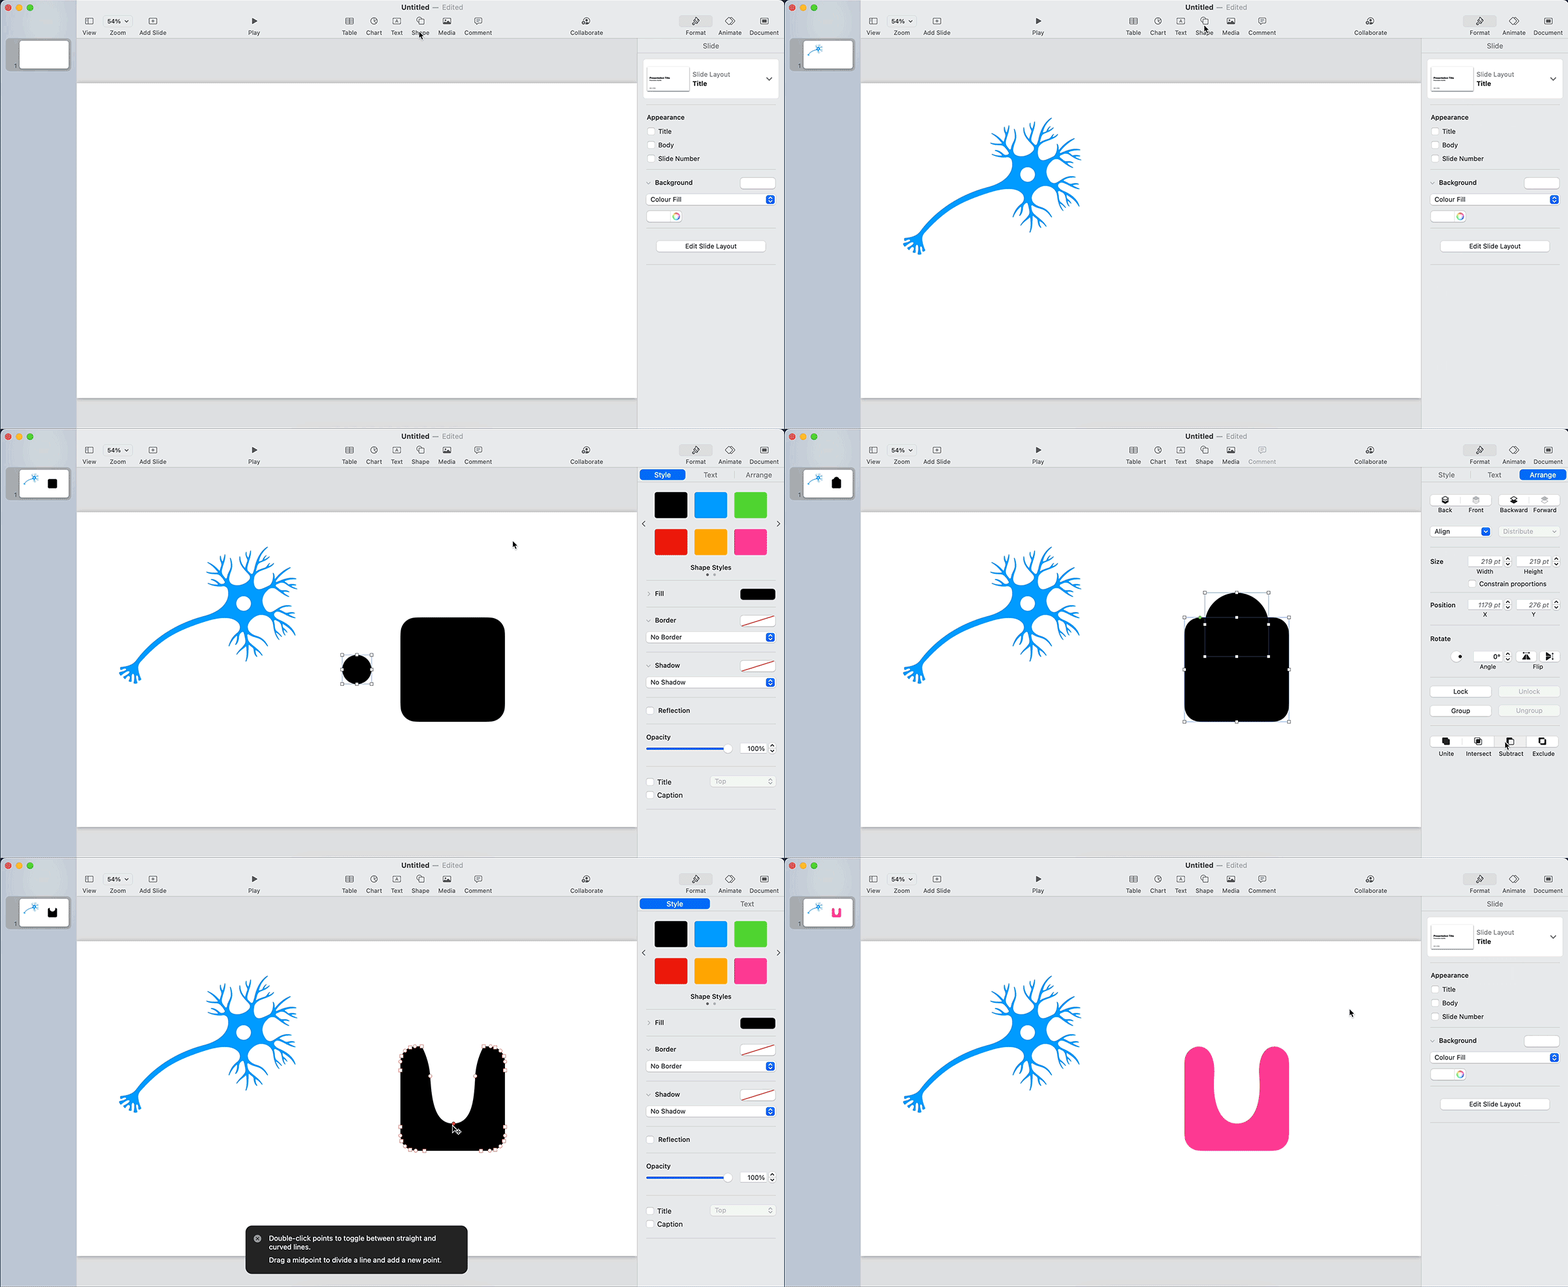
You can play with different shapes and icons to create your scientific illustrations. Keynotes also offers you the possibility to combine different shapes to create new ones, and you can also customize any shapes by modifying its contour. There is even a pen tool to draw elements.
The program also offers the possibility to create animations and, as PowerPoint and Google Slides, is easy to use. The main inconvenient is that you only can have access to Keynotes if you work in the Apple ecosystem.
Looking for something more professional?
Let’s talk about Adobe Illustrator.
Adobe Illustrator is a vector graphics editor and design program used for professional designers and illustrator all over the world. It is the program of choice if you are looking for something with endless possibilities.
With illustrator, you can create anything you can imagine, like scientific illustrations, graphical abstracts, article figures, data visualizations, scientific infographics, and much more.
Having so many options, features and design capabilities, also mean that you can feel overwhelmed the first time you’ll open the program, since there are a lot of panels, icons, and tabs.
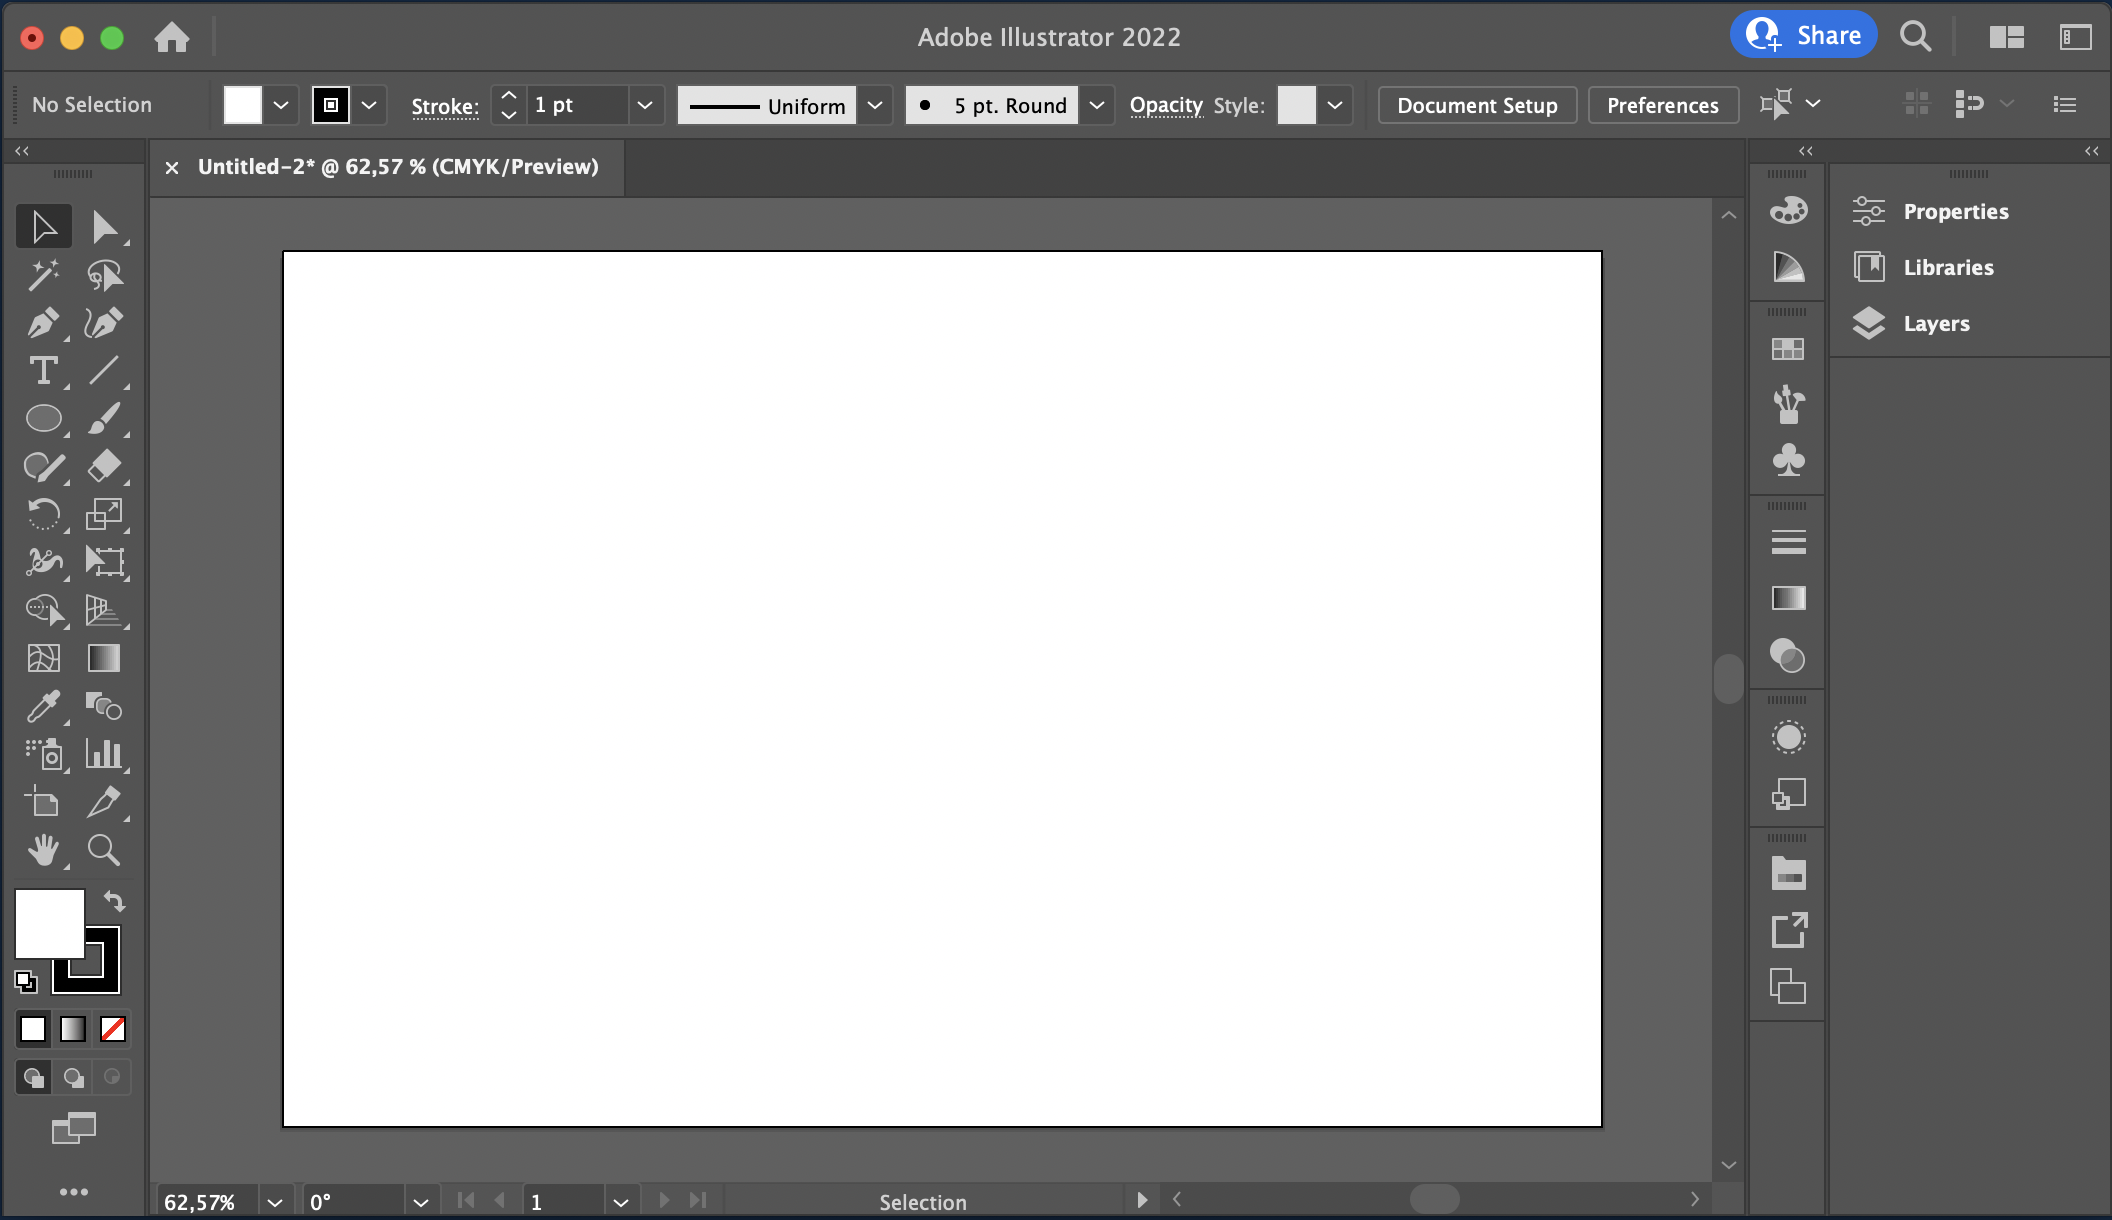
Yes, Illustrator is not easy to use, and require some patience and practice, but is worth the time. Remember that you don’t need to master all the tools. You can start by playing with basic shapes and combining them, with time and some tutorials you will improve your skills.
In addition, since Illustrator is one of the top programs, you will find lots of tutorials on its own website and YouTube. You can also check for some online courses to learn the basics.
The best way to learn is by starting to create something and with a lot of practice!
Beyond its complexity, the other disadvantage of Illustrator is the price. Illustrator is a paid monthly or yearly subscription, with plans starting at €23.79/Month. Yes, not the cheapest options if you just want to create an illustration once in a while.
If you want to check if illustrator is the best option for you, Adobe offers a free seven-day trial. Students also have access to some discounts.
Is there something like Illustrator but cheaper?
Let’s have a look at Affinity Designer.
If you are looking for something professional like Illustrator, but you don’t want to pay every month for it, check Affinity Designer.
Affinity Designer was conceived to compete directly with Illustrator, so it has all the features and options to create great digital scientific illustrations.
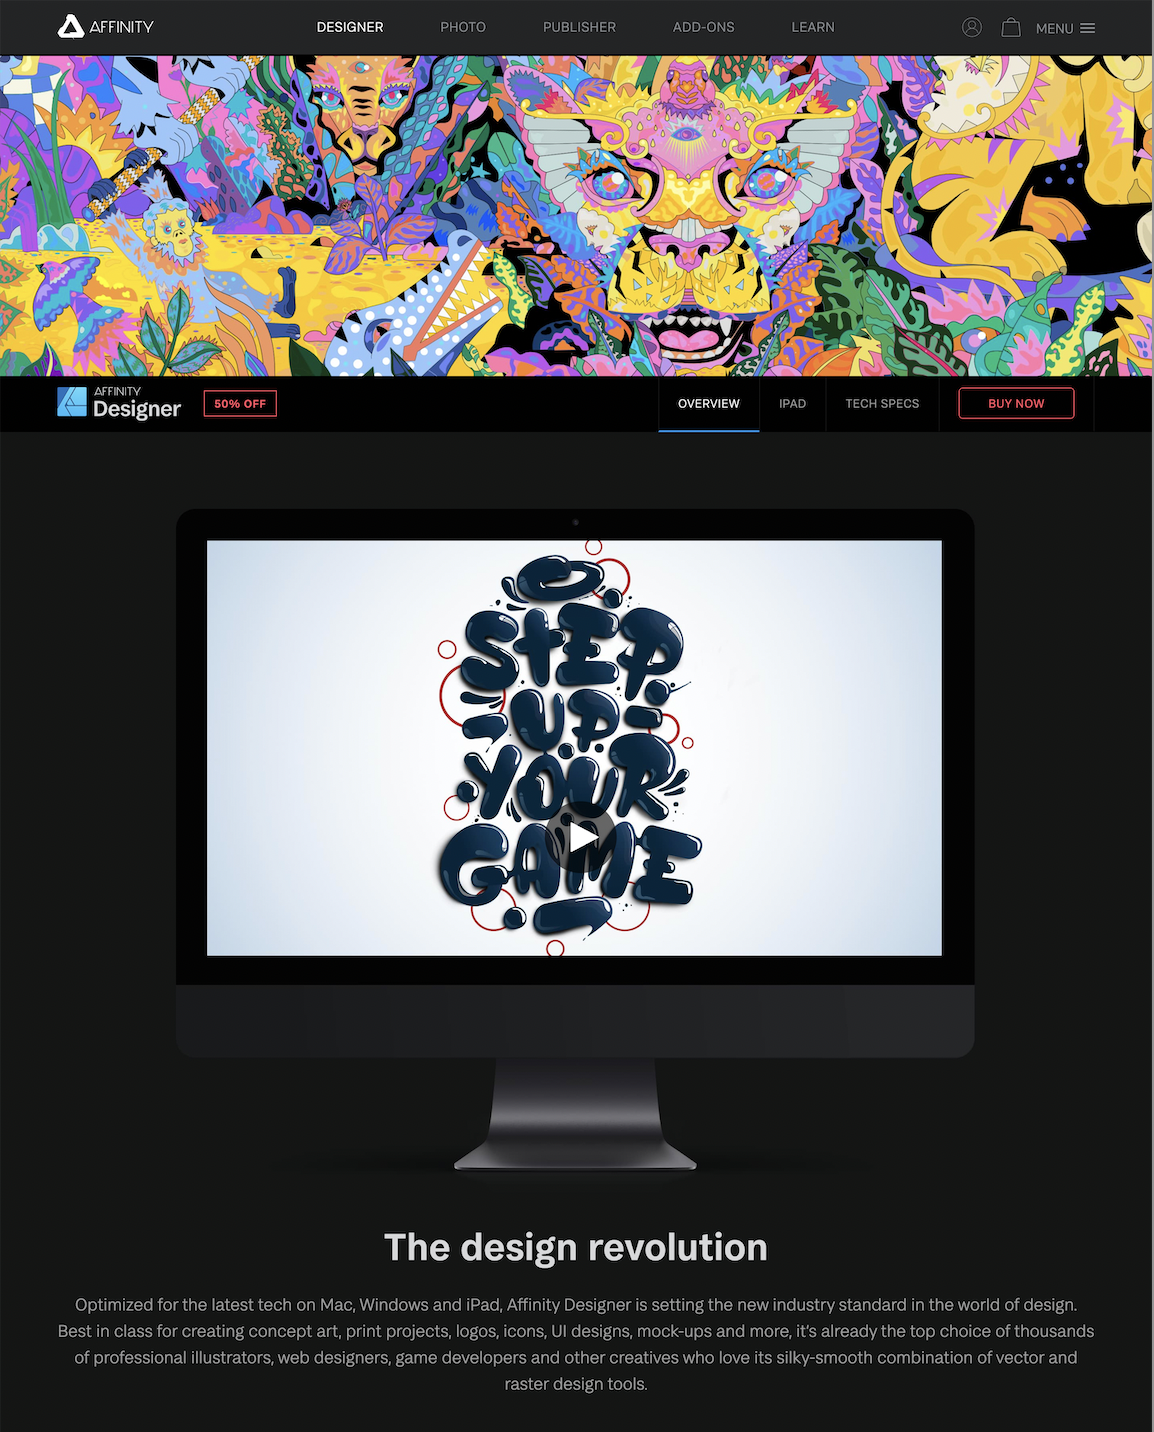
With Affinity Designer, you can create vector graphics, but it also allows you to switch into a raster workspace and add textures to your illustrations. So, it includes some characteristics typically found in Adobe Photoshop.
If you are used to working with Illustrator, you’ll provably get into Affinity Designer fast, since there are lots of similarities between them in terms of workspace. If you are not familiar with none of these programs, no problem, you will find lots of free tutorials on YouTube.
One surprising thing about Affinity Designer is its working speed. Despite being a very complete graphic design software, it runs very fluidly.
Finally, one of the greatest advantages compared with Illustrator is that you don’t have to pay monthly. You can have access to Affinity Designer with one-off payment of $54.99 with no subscriptions. But, before buying it try the 30-days free trial to check if that is the best option for you!
Is there a vector program for scientific illustrations 100% free?
Yes, let’s talk about Inkscape!
If you are looking for a professional vector graphics editor to create scientific illustrations and graphical abstracts, but you don’t way to spend any money on it, then Inkscape is the program for you! It’s free and open source and works for Windows, macOS, and Linux.
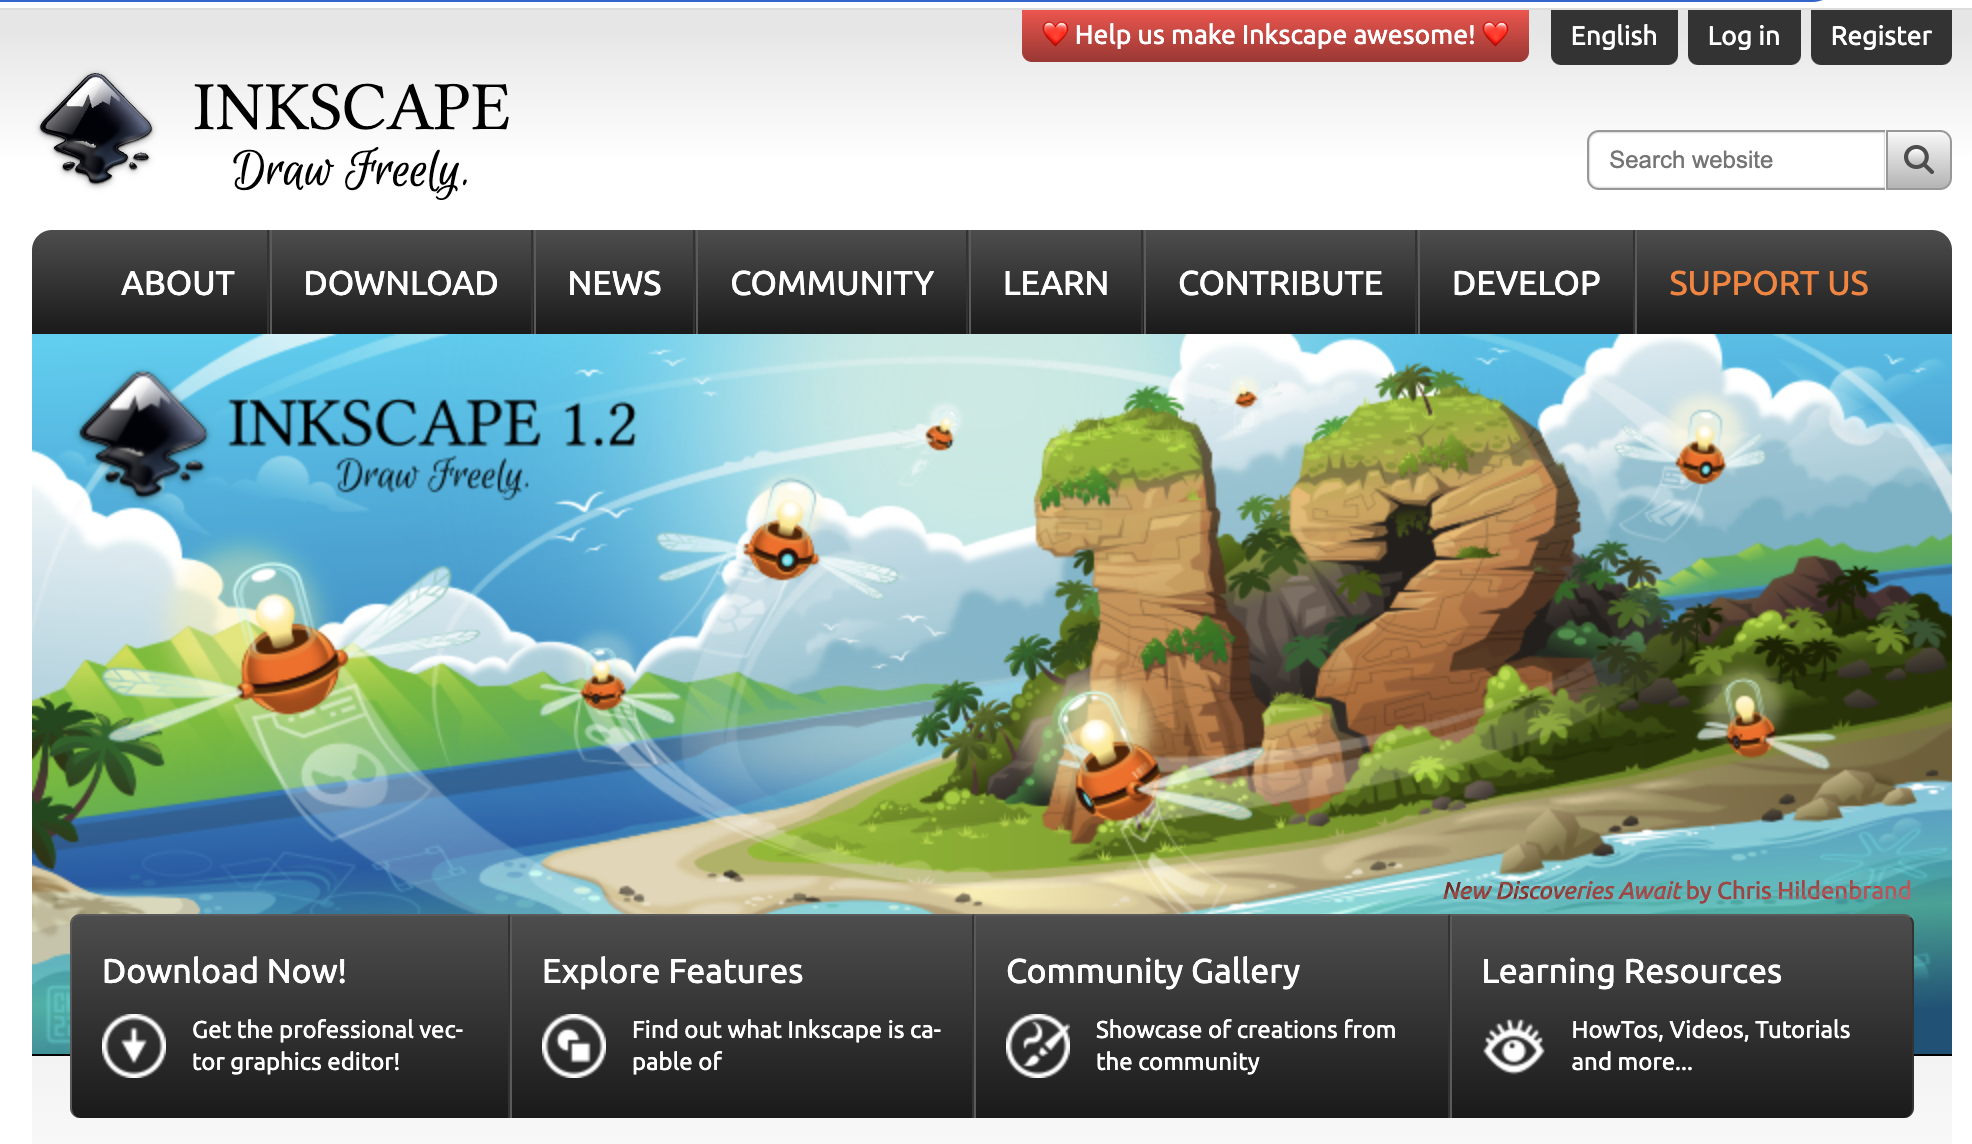
This program offers lots of tools and resources to make detailed and professional illustrations. With Inkscape, you can create different objects by using the shape and pen tool, and it’s also possible to transform and combine shapes together to create new ones.
Despite Inkscape is still not as popular as Adobe Illustrator or Affinity Designer, you can find free tutorials on its website and on YouTube to get you started.
This program may not be the fanciest one nor the easiest to use, but is 100% free, so it’s worth a try.
Looking for an extra dimension?
Then you need to try Blender.
If the 2D world is not enough for you, and you are looking for that extra dimension, then Blender is the right program for you.
Blender is a free and open-source 3D software with several features, including 3D modelling, sculpting, 2D and 3D drawing, videos and animation, among others. With Blender, you can, for instance, create amazing 3D scientific illustrations using real protein structure models.
In fact, if you are interested in 3D protein models check BioBlender, an implementation of Blender. This software allows you to load files from Protein Data Bank and display proteins in 3D in a photorealistic way (as atoms or molecular surface).
The main problem with Blender? As you can imagine, is not an easy and an intuitive software. Specially if you are not familiar with professional programs or with other 3D software.
The good news is that the community behind Blender is huge. It is the most popular free program to work with 3D, so you will find lots of tutorials on its official website and YouTube.
In this post, we have talked about some of the most popular programs among scientist to create graphical abstracts and scientific illustrations.
If you feel a bit overwhelmed with so many options, here is a summary table with the key information so you can choose the best program for you:
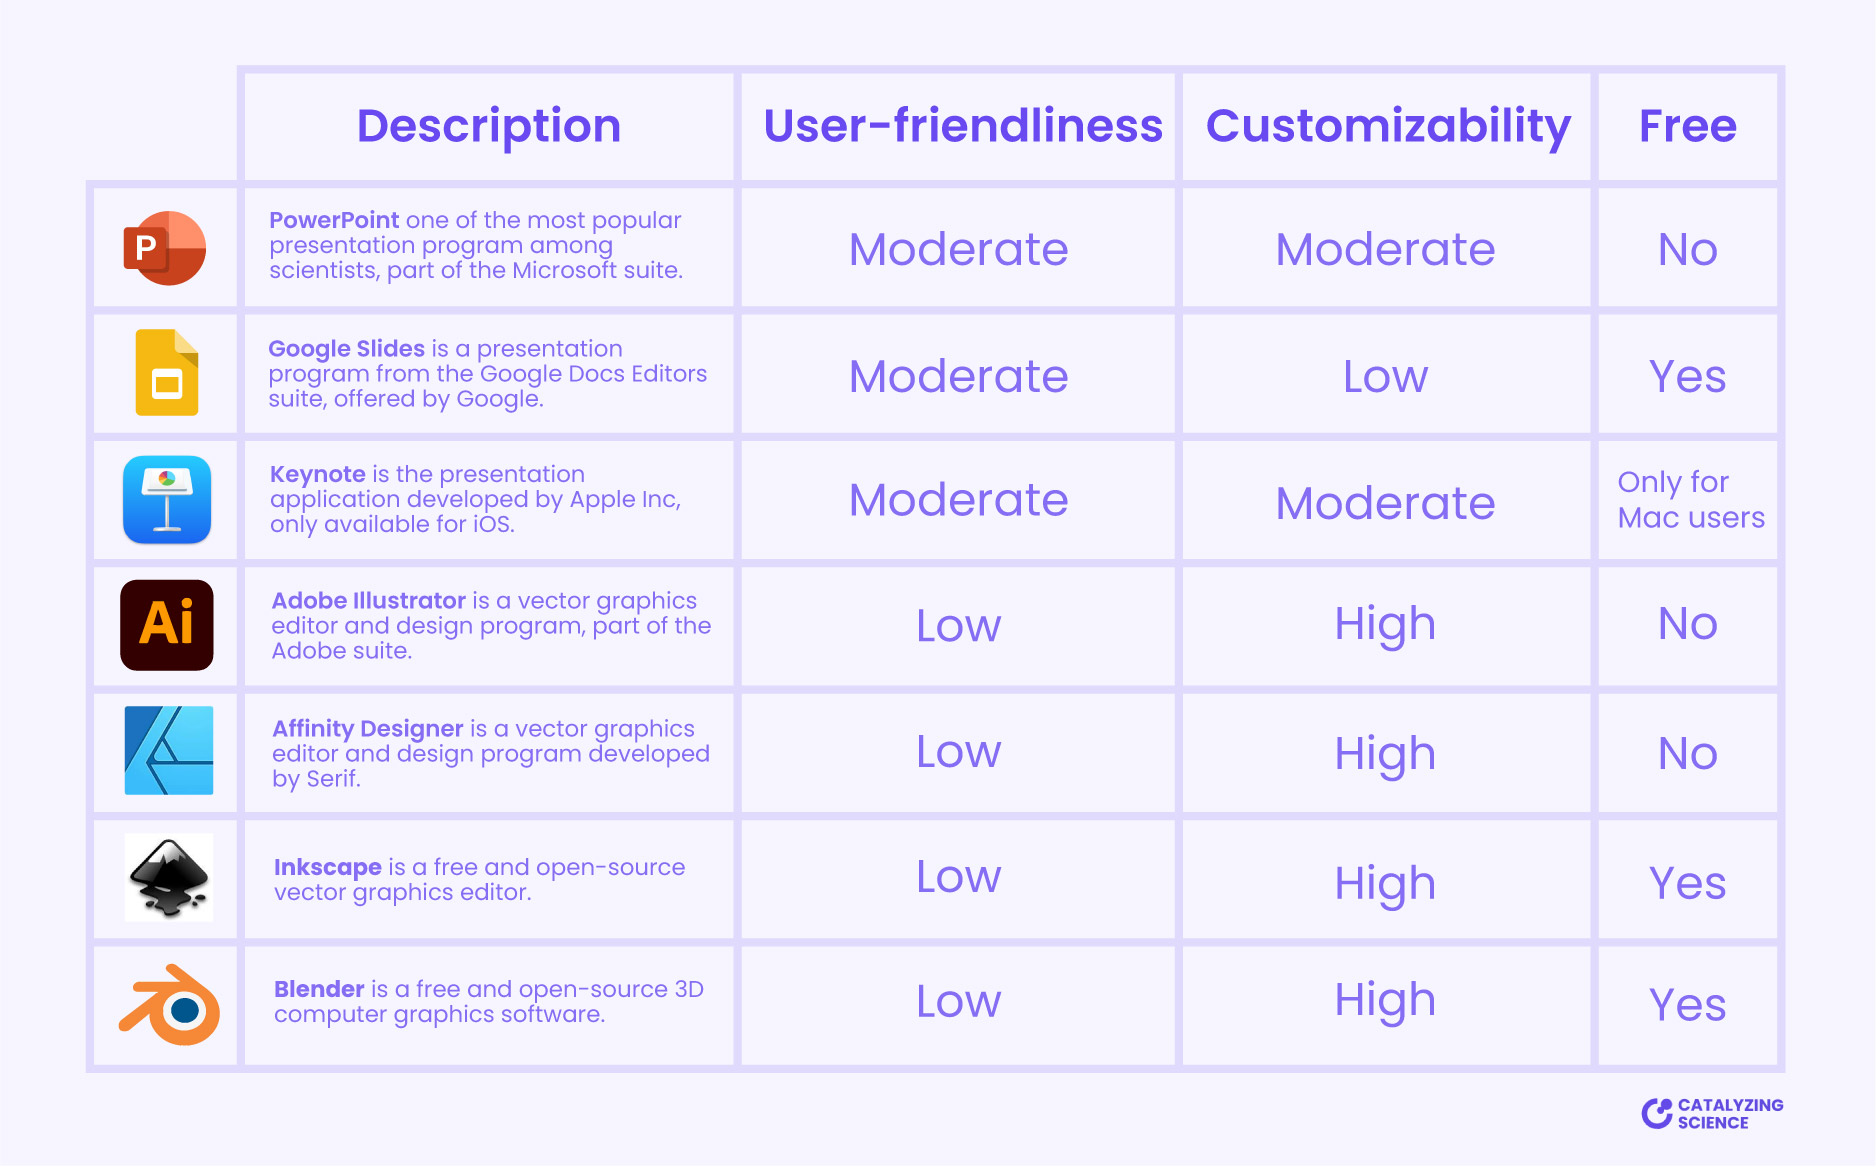
Remember that having a fancy program is not going to make your illustration look better. To create something great, you’ll first need to gain some skills and to apply some design principles to your scientific illustrations.
Try different options and take advantage of the free trials before paying for one of the professional and expensive options. Sometimes the best option is the one that you already have access to.
No time to learn how to make scientific illustrations with these programs?
No problem! We can help you! We would love to illustrate your research for you!
Have a look at our portfolio to see what type of scientific illustrations and graphical abstracts we can create for you.
If you have a custom request, don’t hesitate to contact us to find out what we can do for you!