Portfolio
Previous projects:
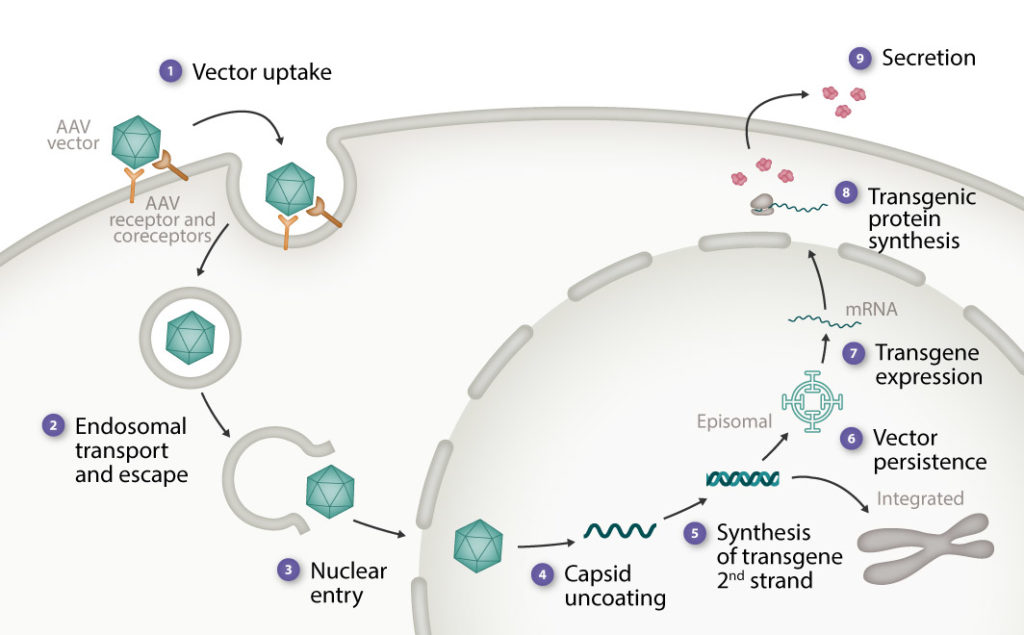
Adeno-associated viral vectors delivery and expression
Scientific illustration
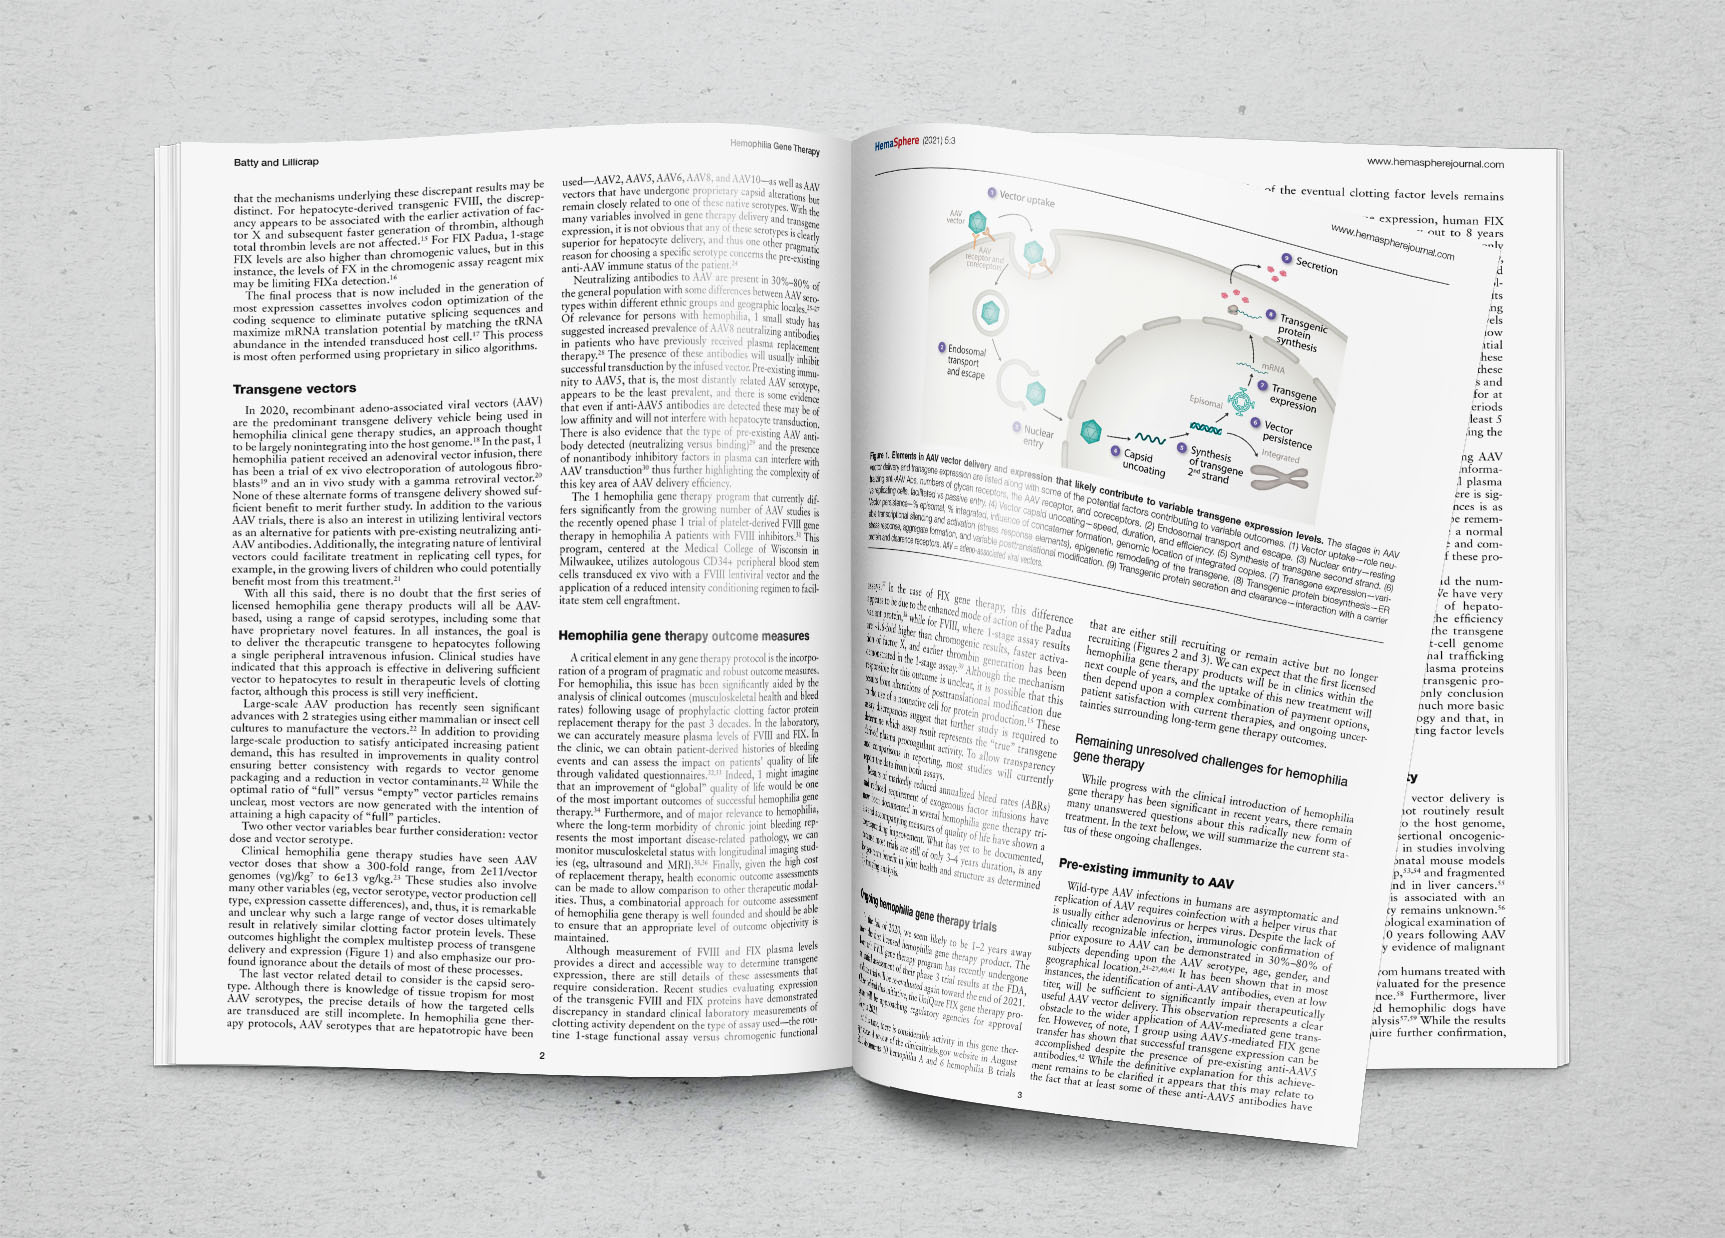
Scientific illustration showing the stages in AAV vector delivery and transgene expression, along with some potential factors that likely contribute to variable expression levels. Illustration made for Somersault18:24 and published in Batty P. and Lillicrap D., Hemasphere. 2021.


Microvascular inflammation in kidney transplant rejection
Thesis cover
Thesis’ cover design for a doctoral project about the phenotypes and mechanisms of microvascular inflammation in kidney transplant rejection.
Following the client’s specification, the cover was created in a polygonal vector minimalist style. The vasculature of one of the kidneys is highlighted to represent the inflammation, and some pieces are breaking off from the kidney to represent graft loss. The second image corresponds to an alternative proposal, where the kidneys were illustrated as if they were made of wire. This illustration was created in collaboration with Somersault18:24.

Coronavirus illustration
Scientific illustration
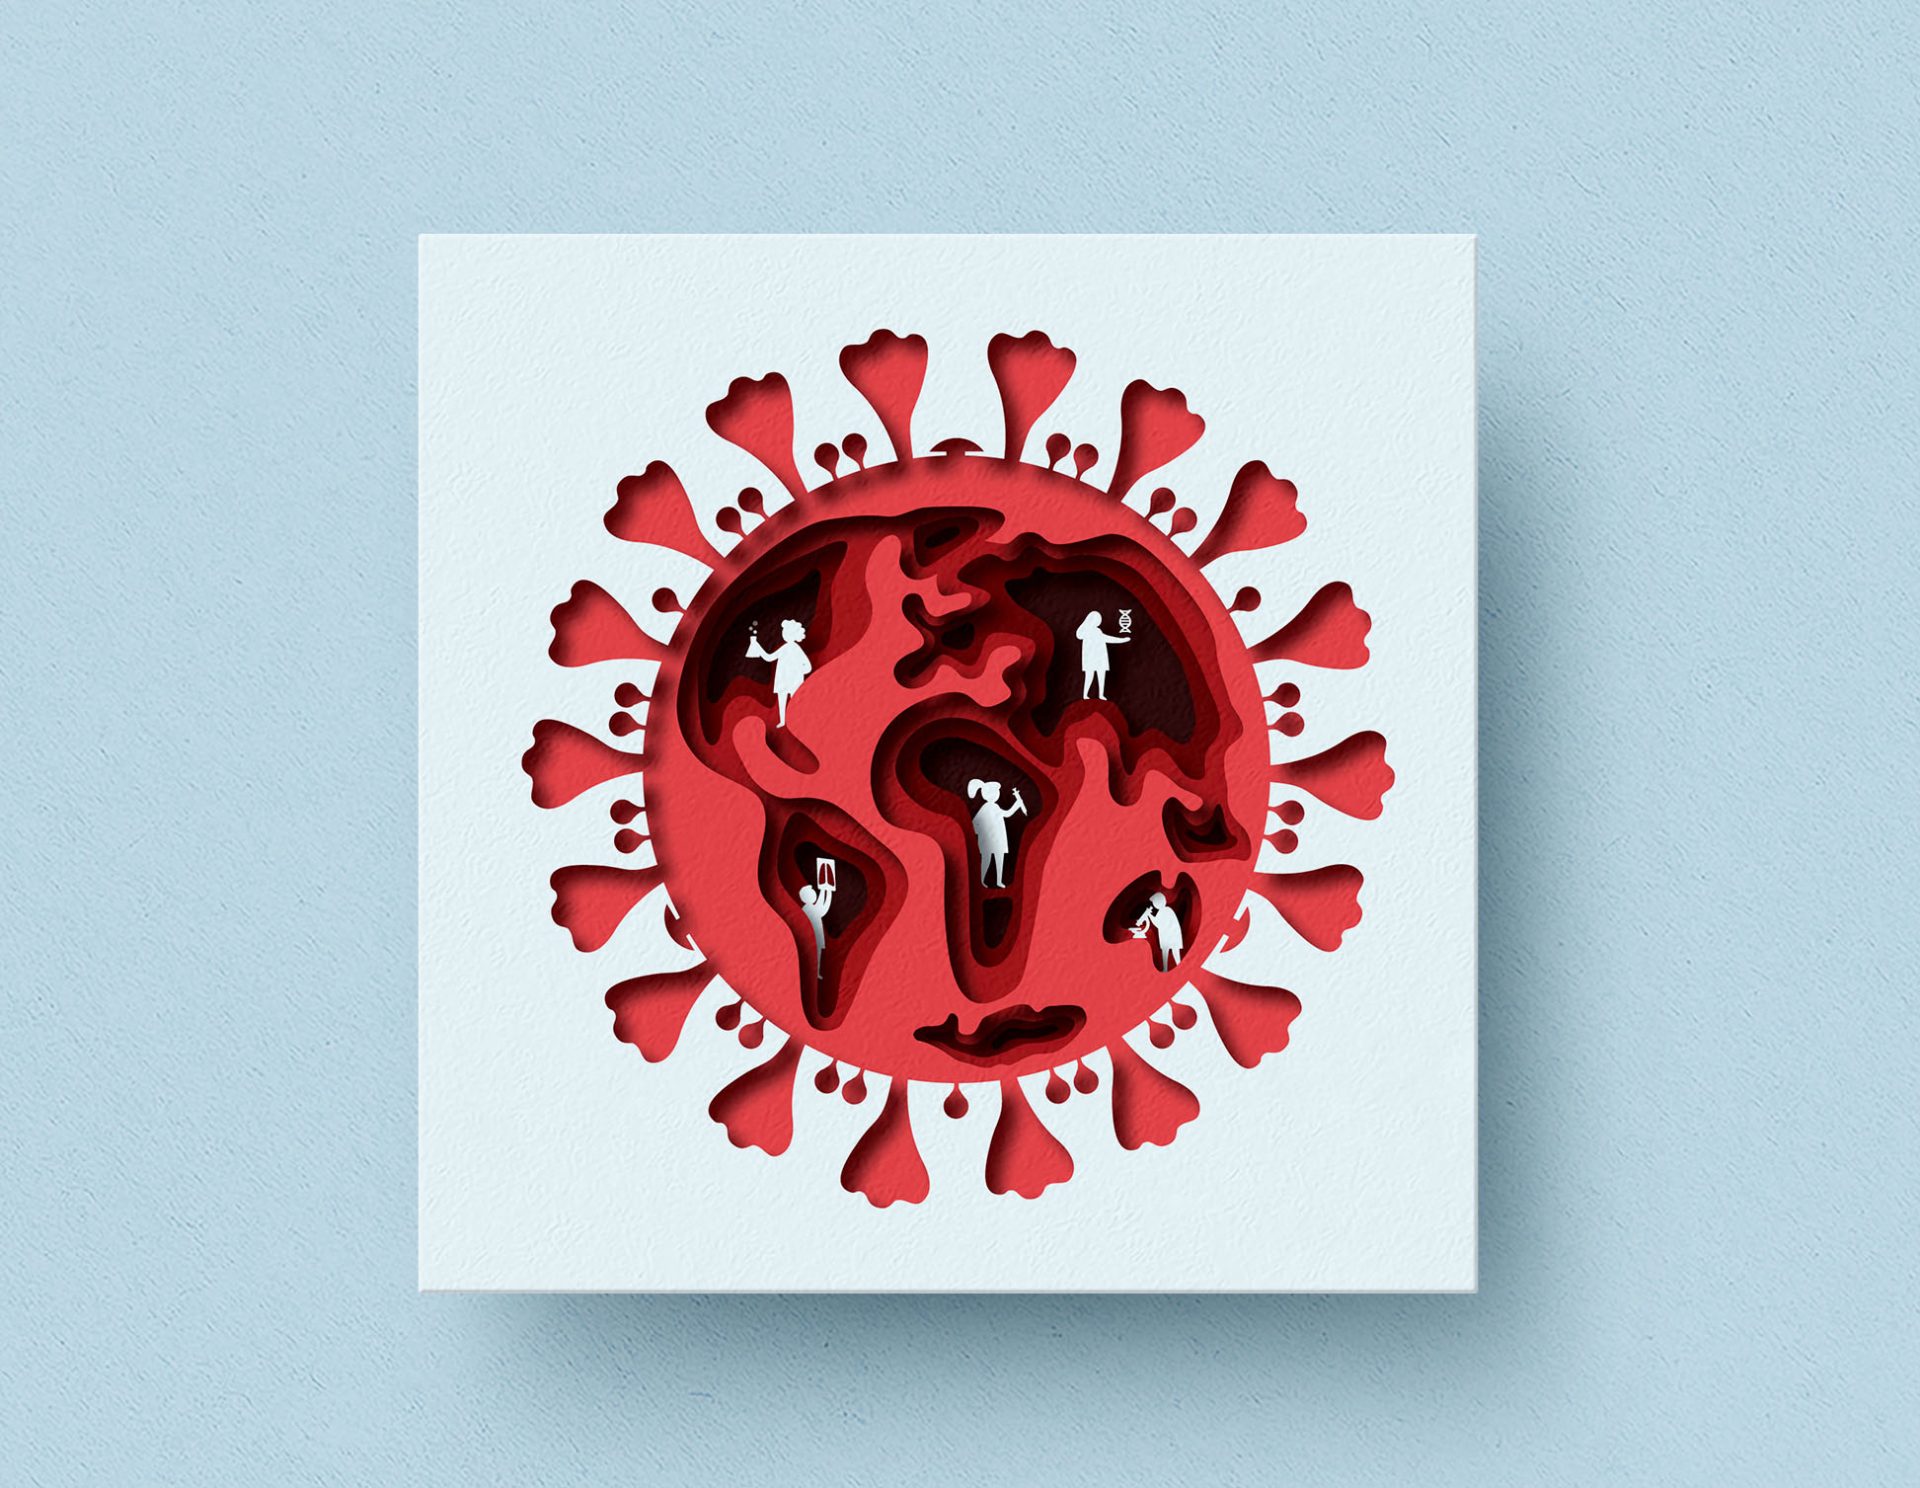
Scientific illustration proposal for a poster of a scientific event. The aim of the illustration was to symbolize the scientific effort made worldwide during the pandemic.
In the illustration created with a paper cut style, the world is represented with the shape of a coronavirus. The illustration also shows how scientist from all over the world work together to find a cure and to control the pandemic.
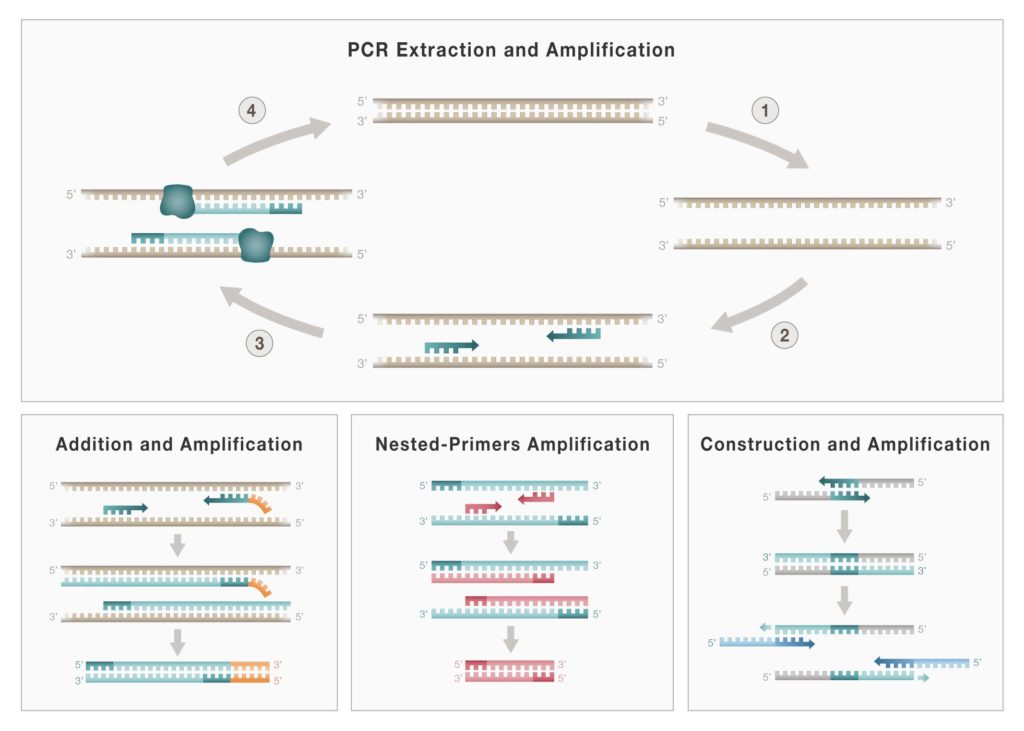
The PCR method
Graphical abstract
Graphical abstract describing the PCR method developed by Kary Mullis. Based on information from Mullis, K. et al. Cold Spring Harb Symp Quant Biol. 1986.
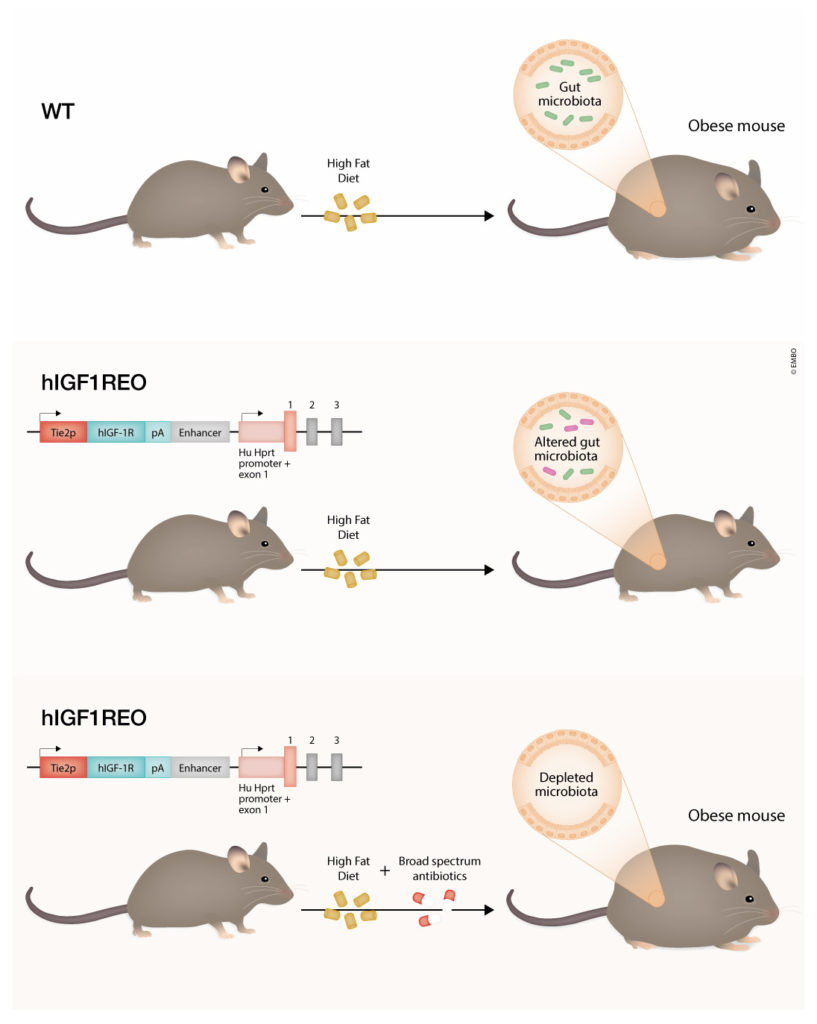
The endothelium and the gut microbiota
Scientific illustration
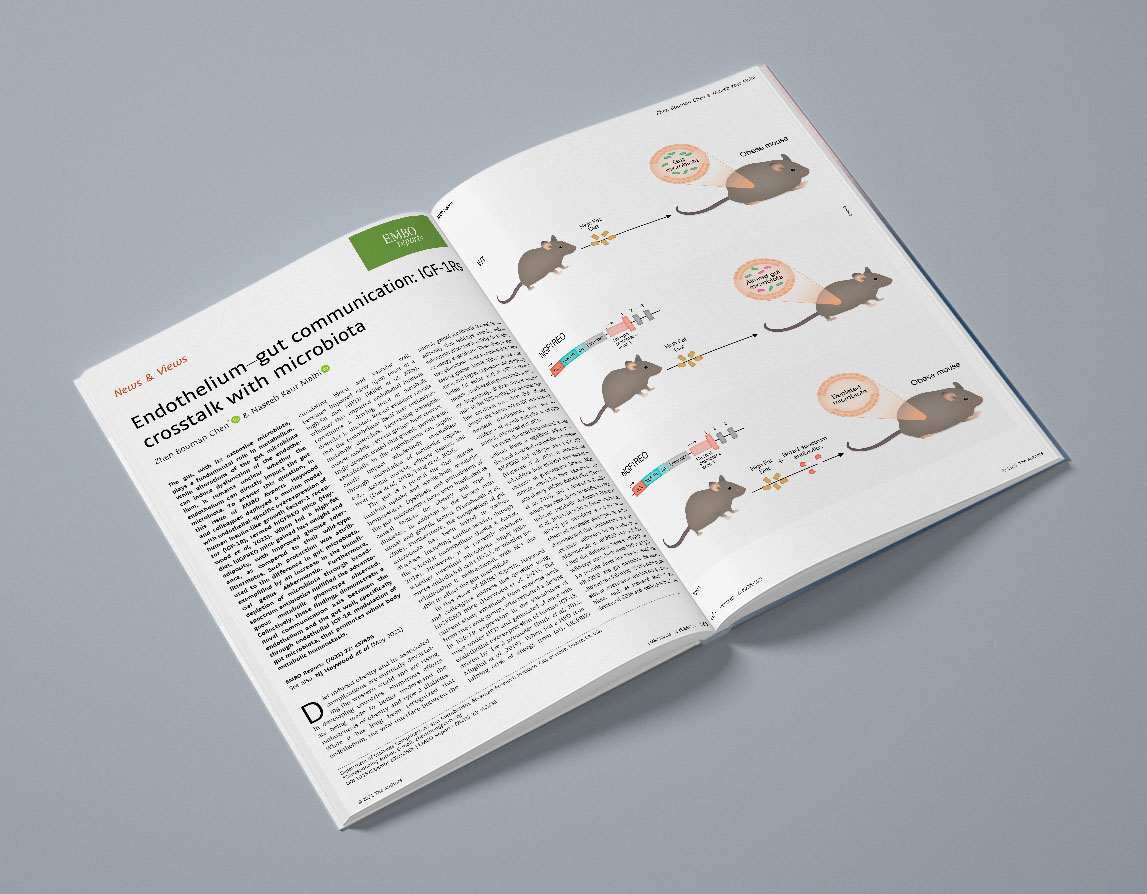
Scientific illustration showing how IGF-1 receptor expression in mice mediates crosstalk with the gut wall to regulate microbiota in obesity. Illustration made in collaboration with Somersault 18:24 and published in Bouman Chen Z. and Kaur Malhi N. EMBO Reports. 2021.
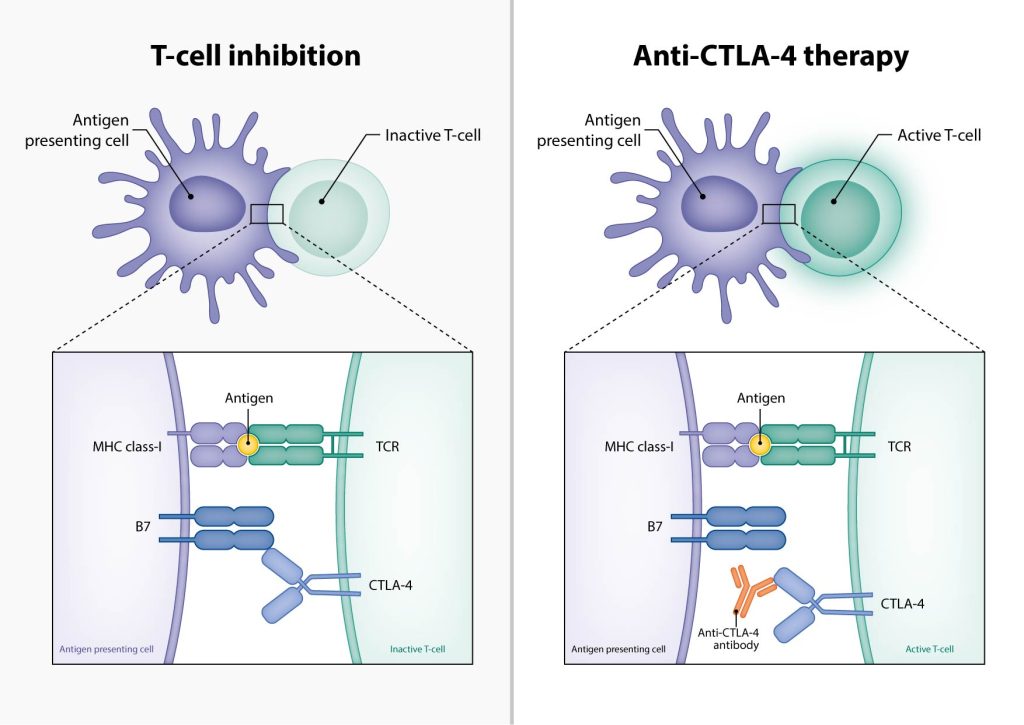
Anti-CTLA-4 therapy
Scientific illustration
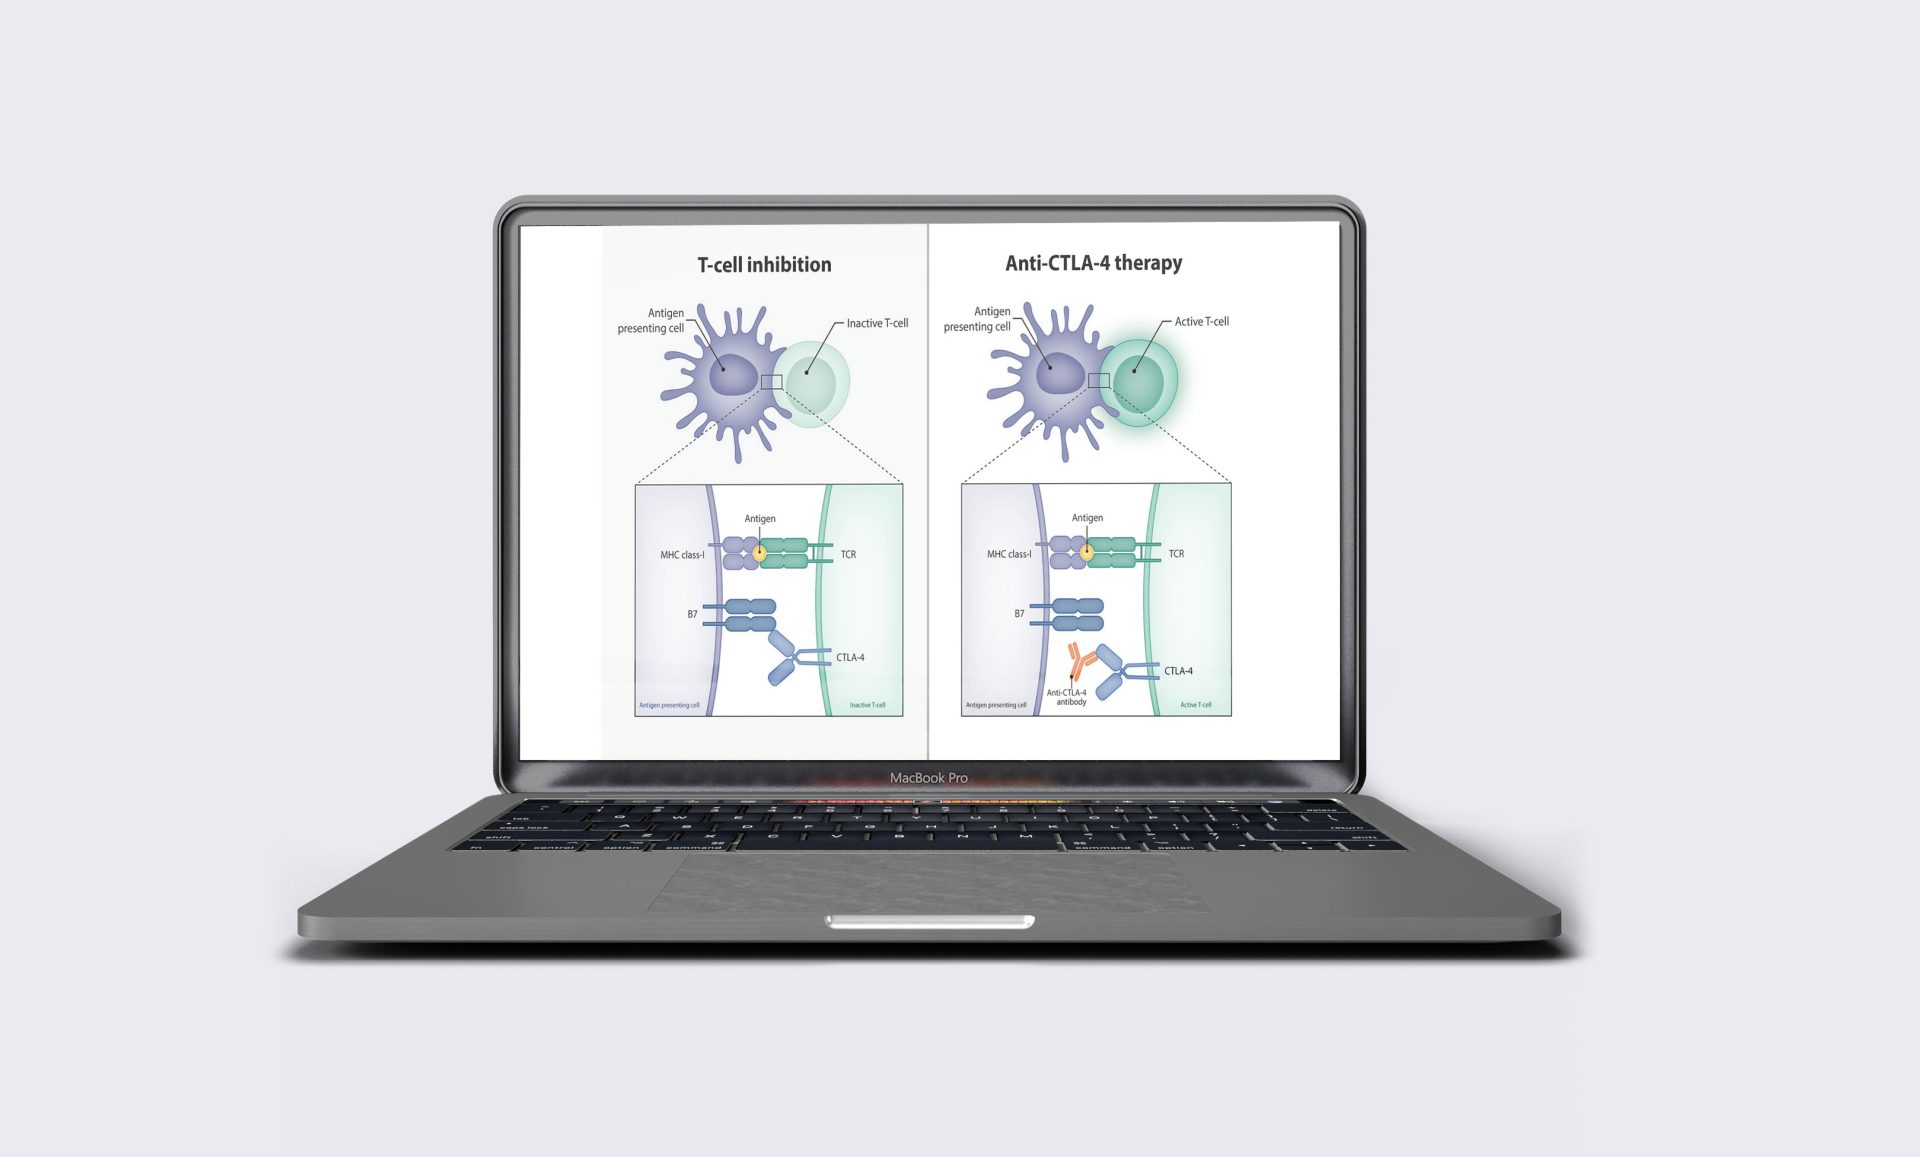
Immune checkpoints are control mechanisms of the immune system. They can be turned on or off to start an immune response, and are crucial to prevent the immune system from targeting healthy cells in the body. Tumor cells can mimic these mechanisms and be mistakenly perceived as healthy cells, thus evading the attack of the immune system.
This scientific illustration shows how anti-CTLA-4 therapy blocks the interaction between CTLA-4 and its ligand B7, promoting T cell activation.
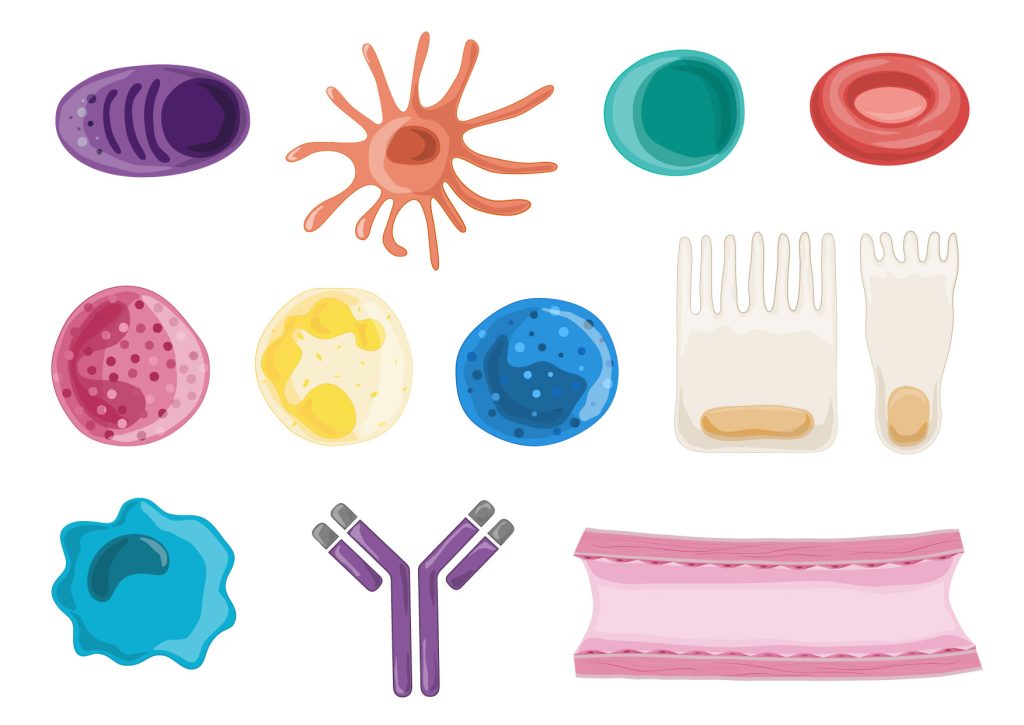
Set of personalized scientific illustrations
Scientific illustrations
Set of personalized scientific illustrations created as a lab resource to be used freely in scientific presentations, posters, publications and any type of scientific communication. All the elements of the set were created separately, so they can be combined freely to create more complex figures.
According to customer needs, this set includes illustrations of: a plasma cell, a dendritic cell, a lymphocyte, an eosinophil, a neutrophil, a basophil, an erythrocyte, an epithelial cell, a goblet cell, a macrophage, an antibody, and a blood vessel.

Cherry blossom neuron
Journal cover proposal
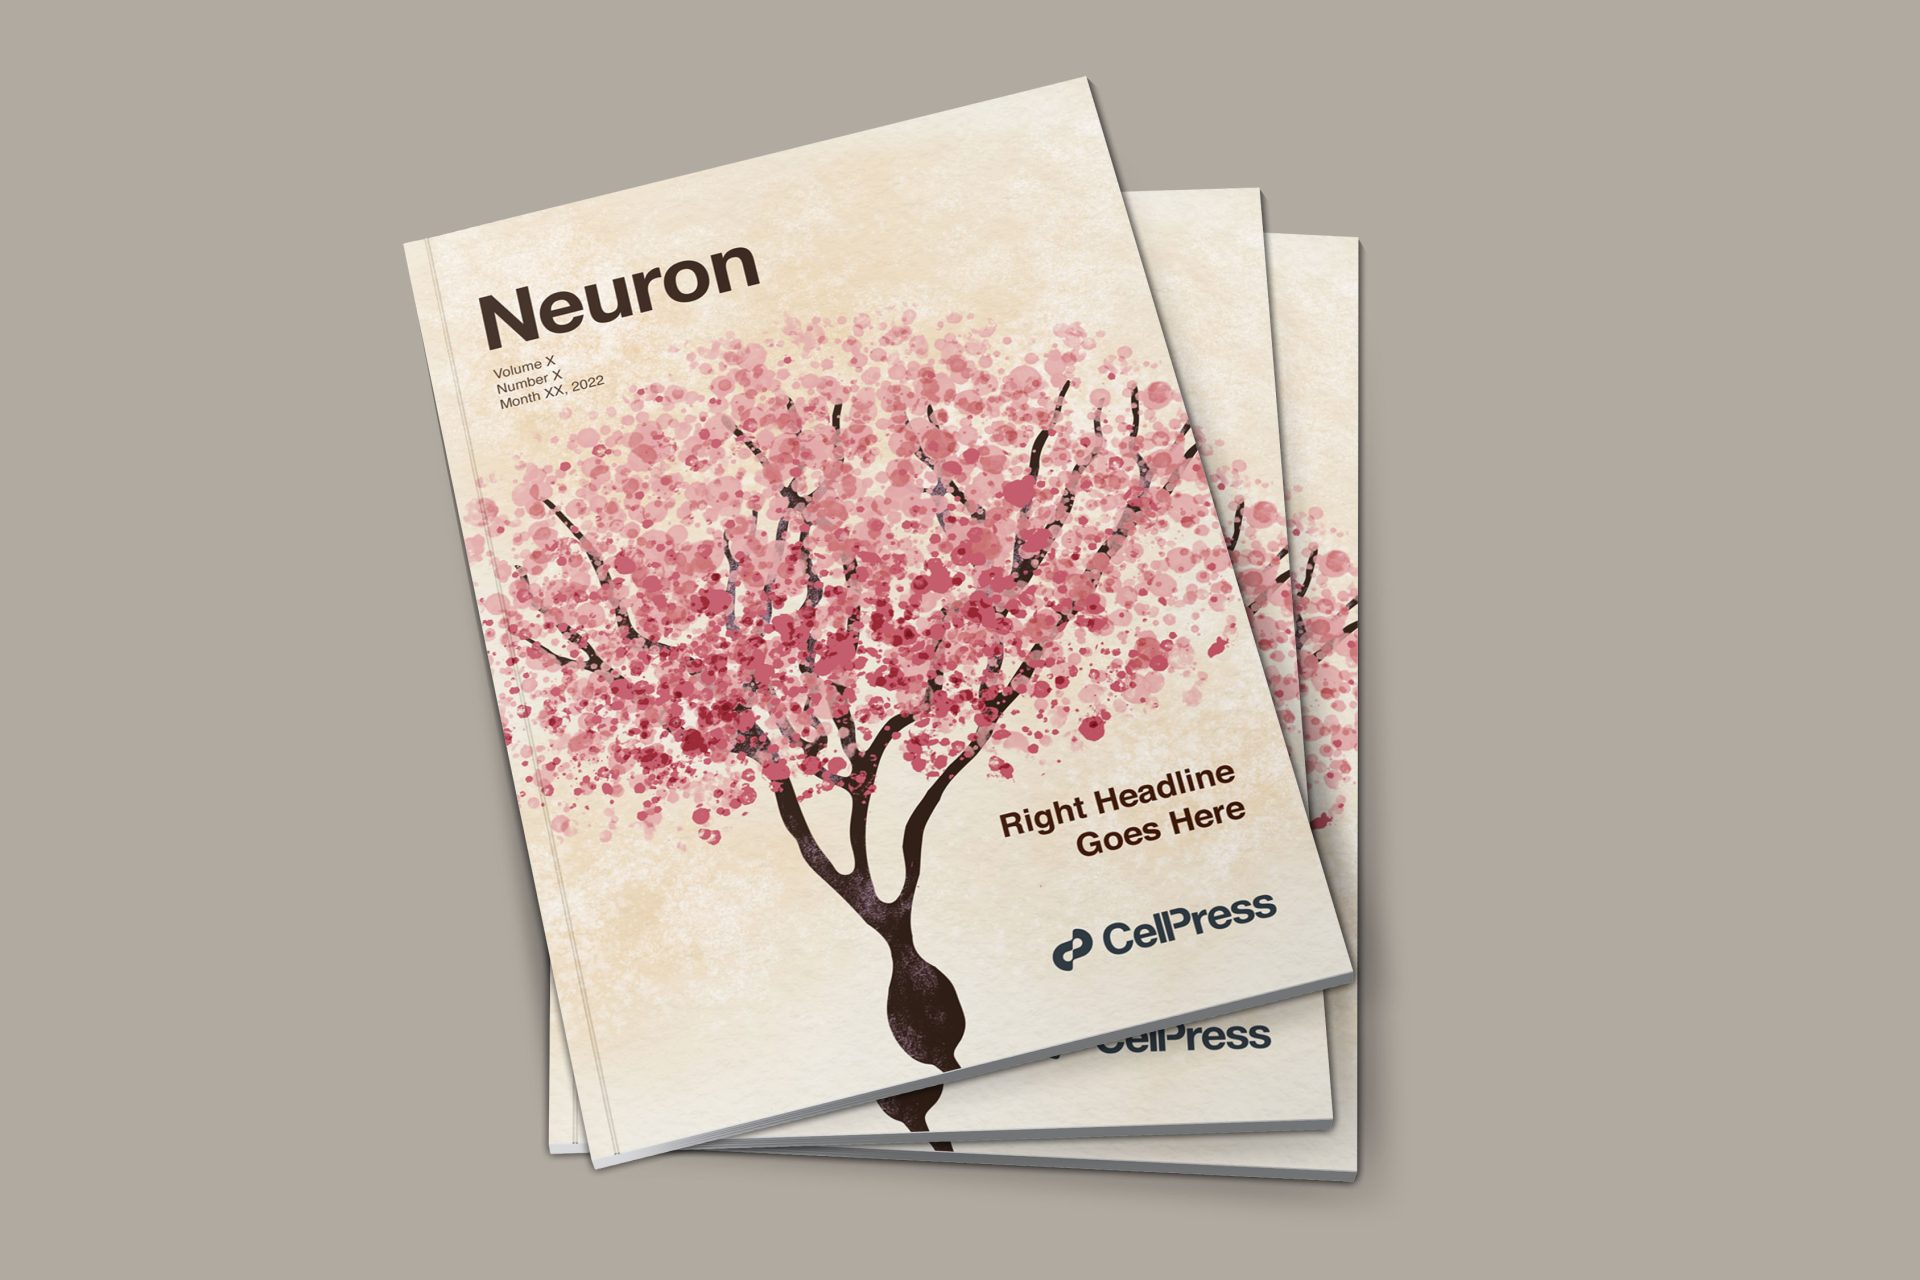
Cover proposal for Neuron Cell Press journal, created for the publication of Peter Scheiffele lab, by Hauser D., et al. Neuron, 2022.
In the watercolor style illustration, a neuron is represented as a cherry blossom tree. The flowers represented as pink dots simulate the dots observe in an immunofluorescence staining.

Selective autophagy-like pathways.
Scientific illustration
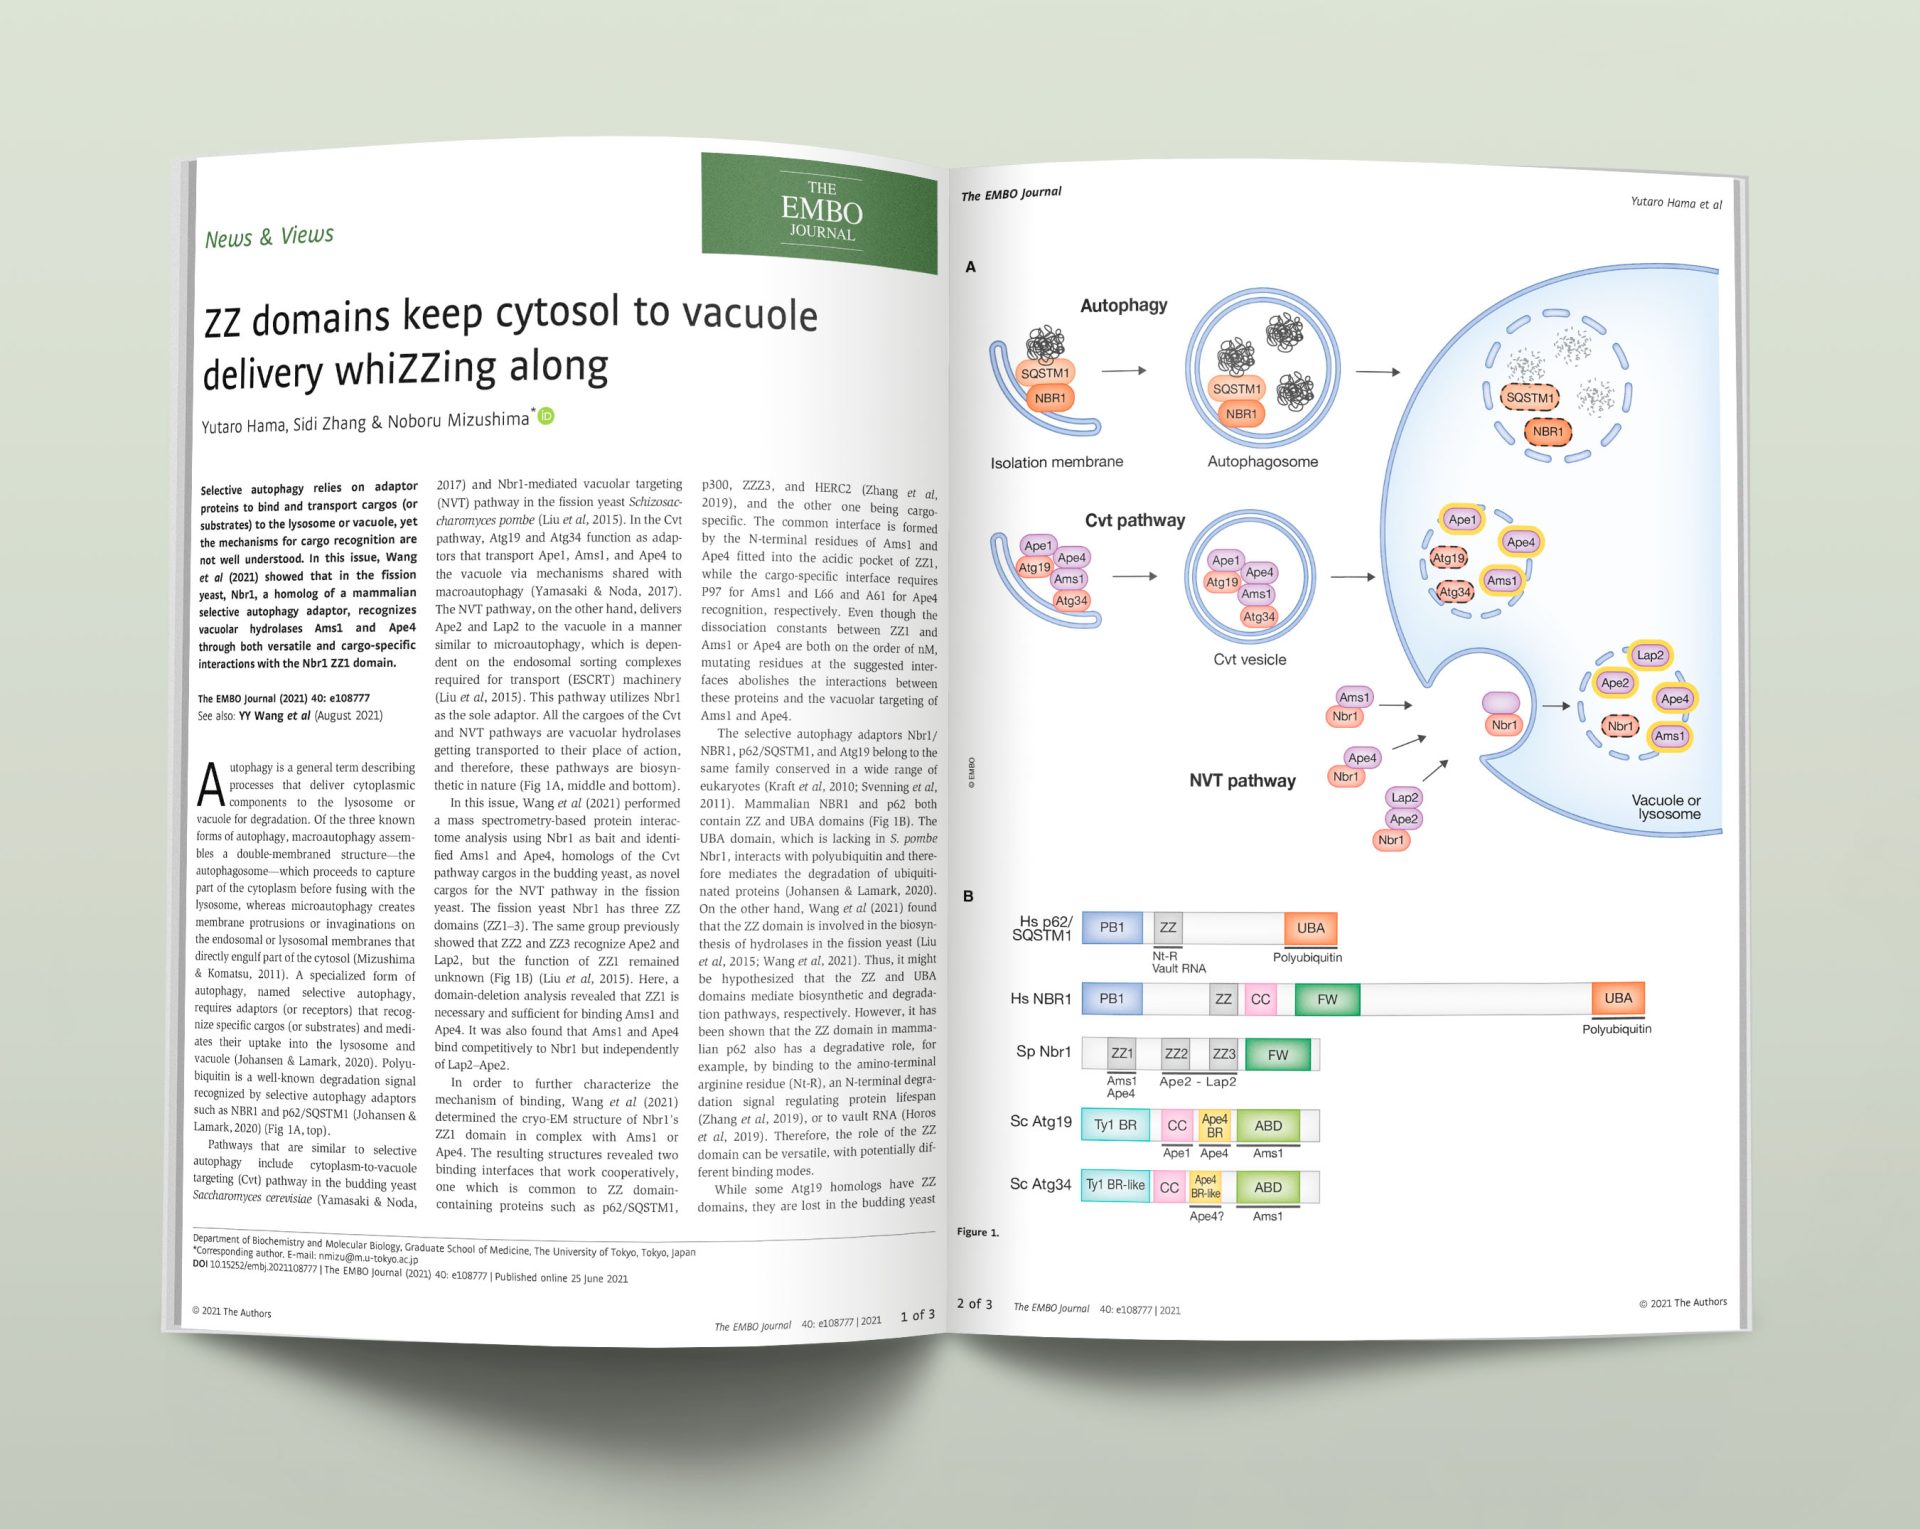
Scientific illustration showing a schematic diagram of the canonical autophagy, Cvt, and NVT pathways. Illustration made for Somersault18:24 and published in Hama, Y. et al. EMBO Journal. 2021.
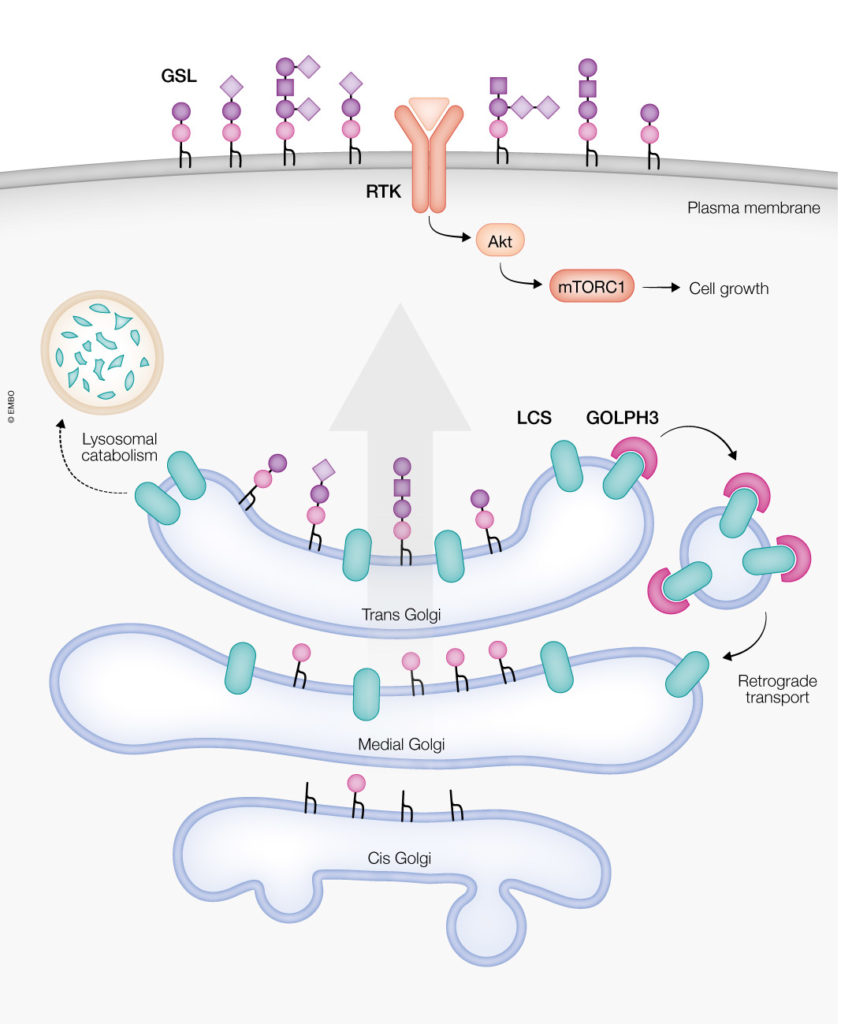
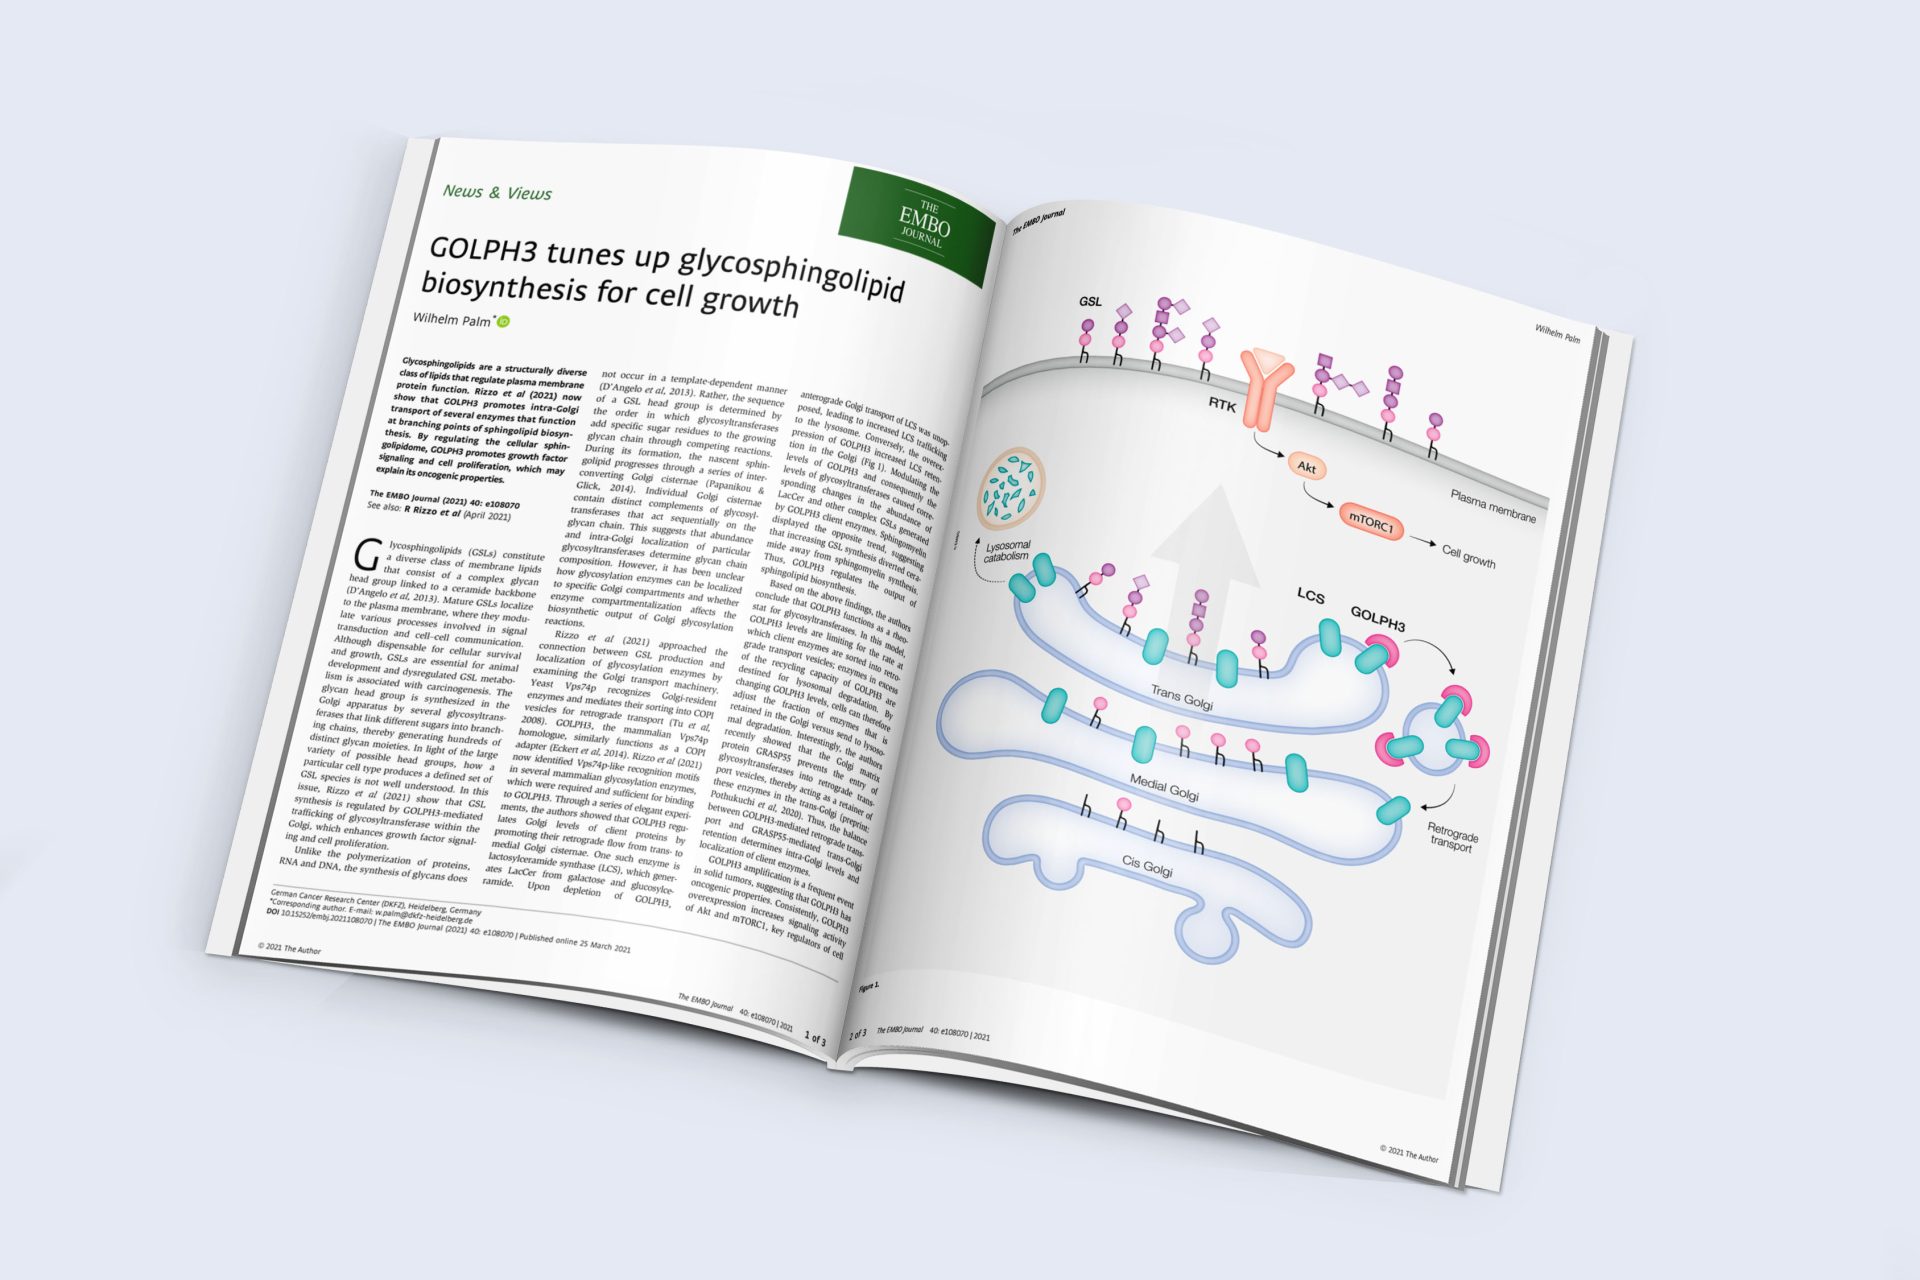
Role of GOLPH3 in regulating client enzymes levels and glycosphingolipids synthesis
Scientific illustration
Scientific illustration showing how GOLPH3 promotes lactosylceramide synthase (LCS) retention in the Golgi by mediating its retrograde transport from trans- to medial Golgi cisternae. LCS retention favors biosynthesis of glycosphingolipids (GSLs), which enhance signaling through the growth factor receptor tyrosine kinase (RTK) promoting cell growth. Illustration made for Somersault18:24 and published in Palm W. EMBO Journal. 2021.
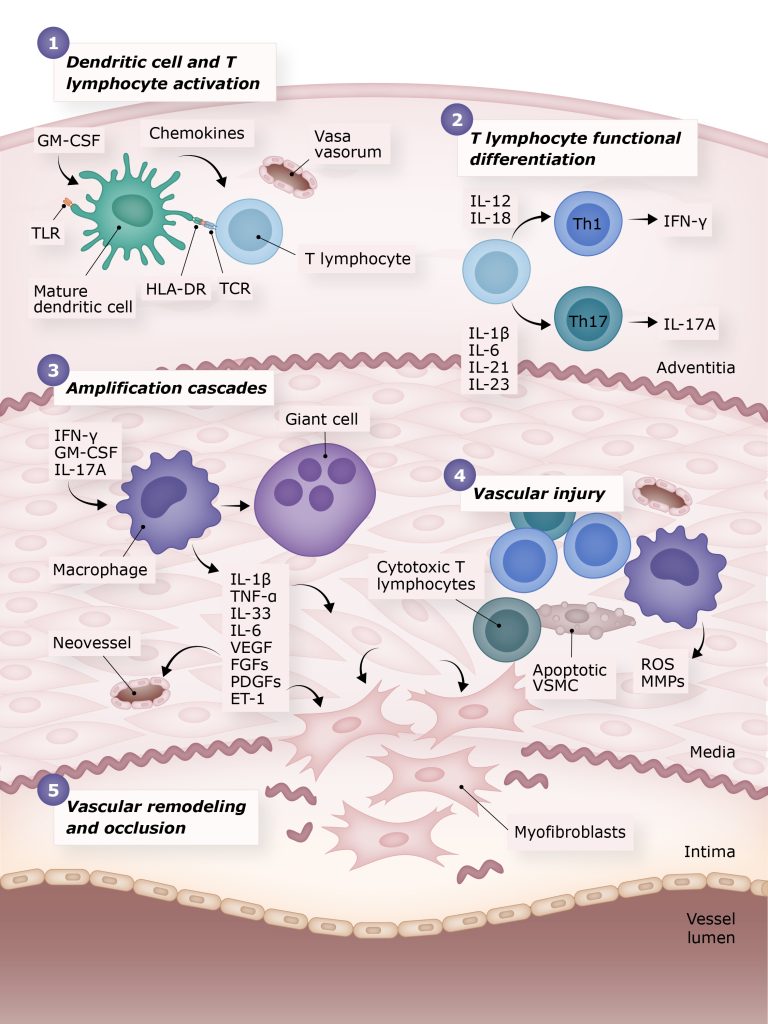
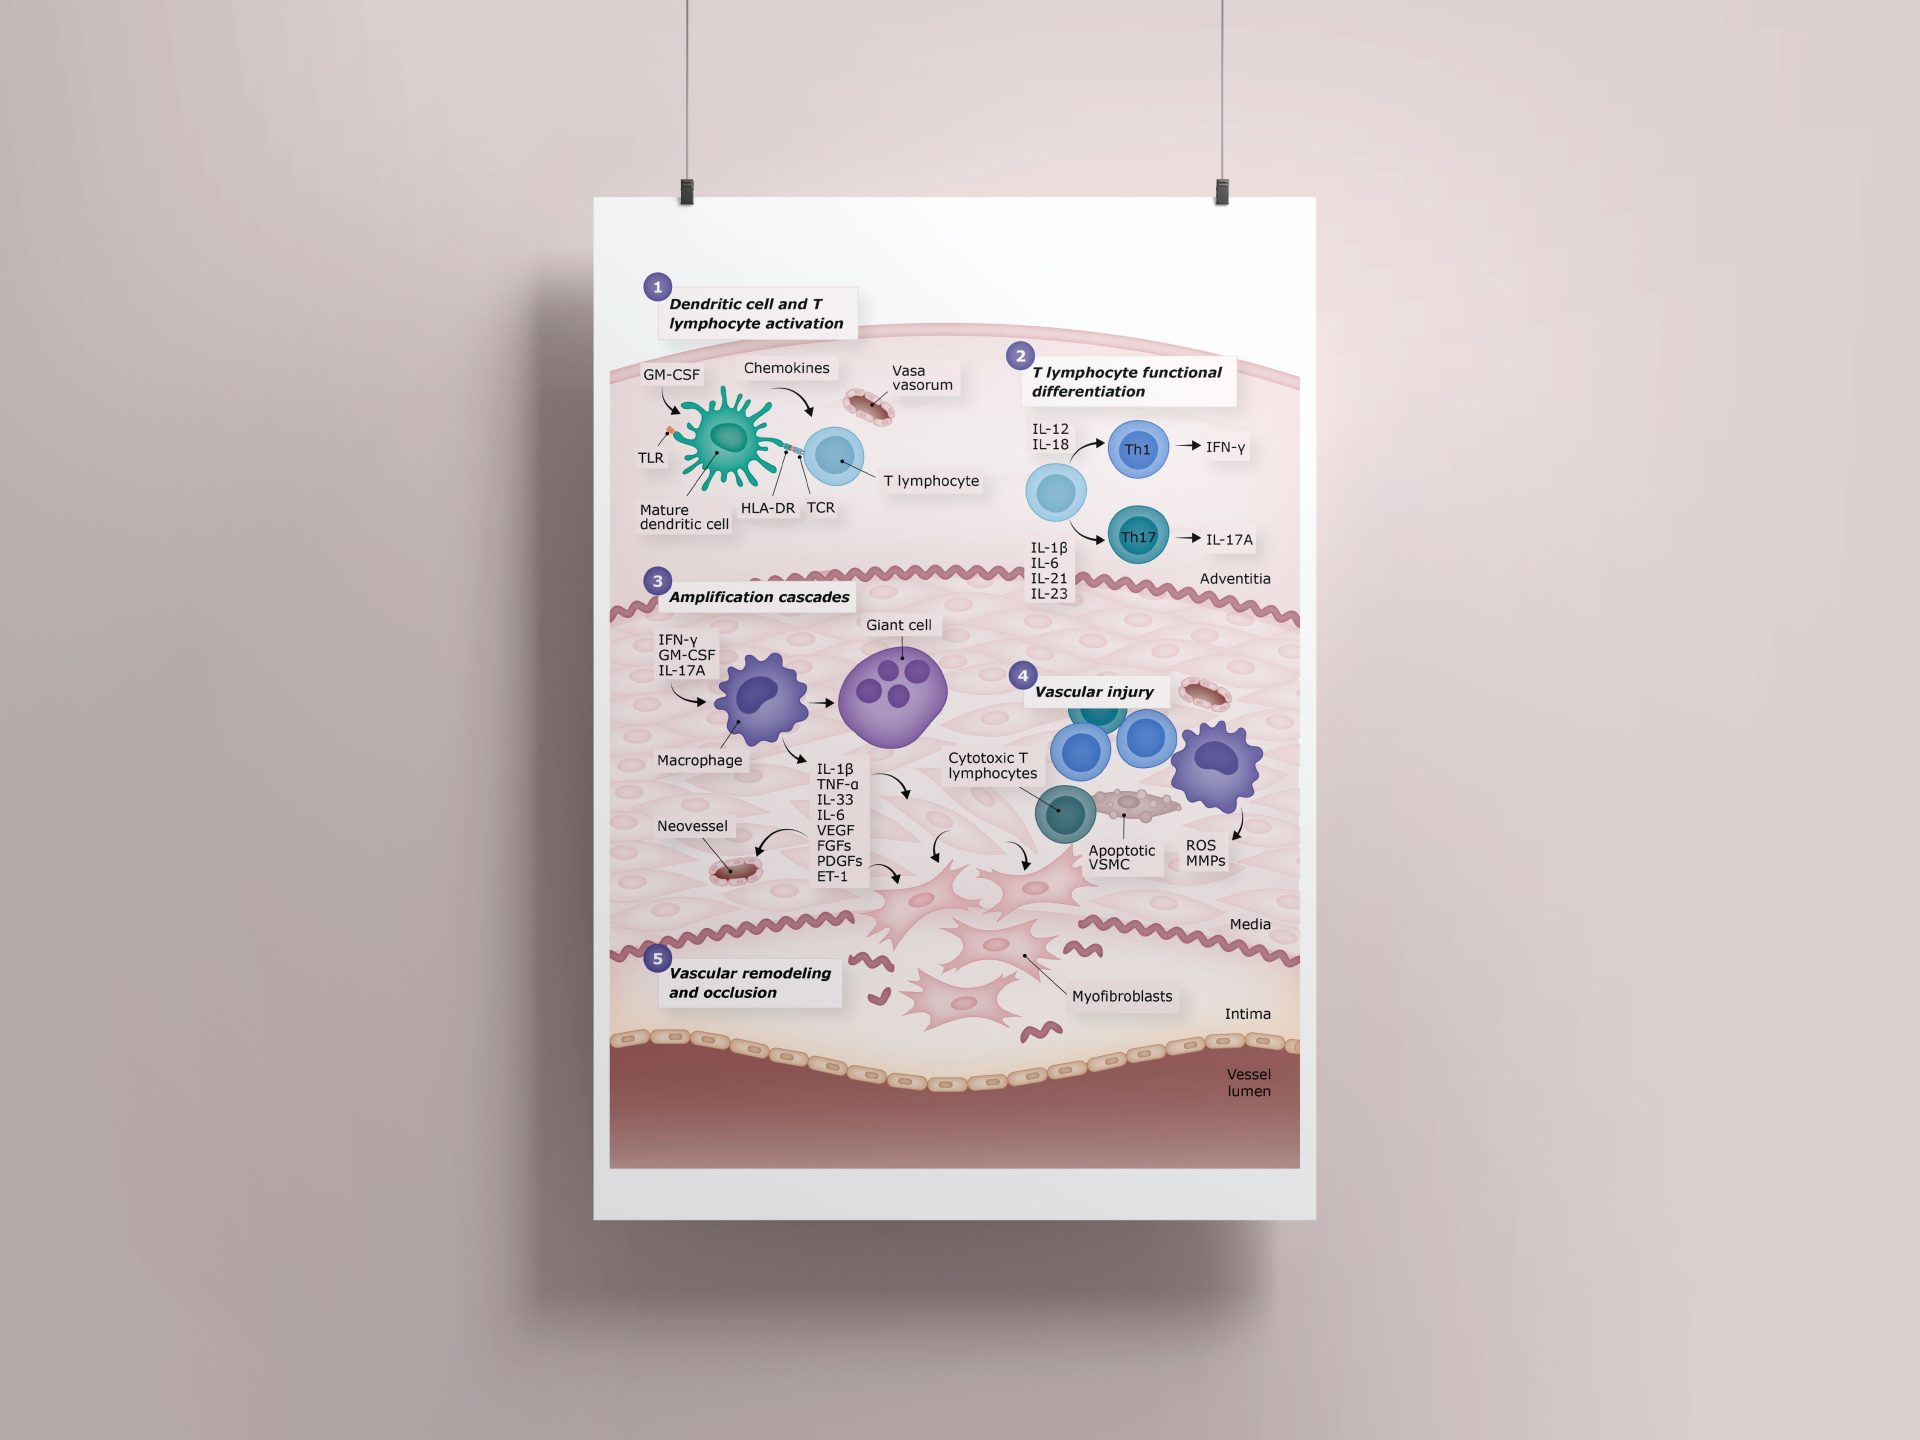
Pathogenesis of giant cell arteritis
Scientific illustration
Scientific illustration created to visually summarize the pathogenesis of giant cell arteritis, from dendritic cell and T lymphocyte activation to vascular remodeling and occlusion. Illustration published in UpToDate.
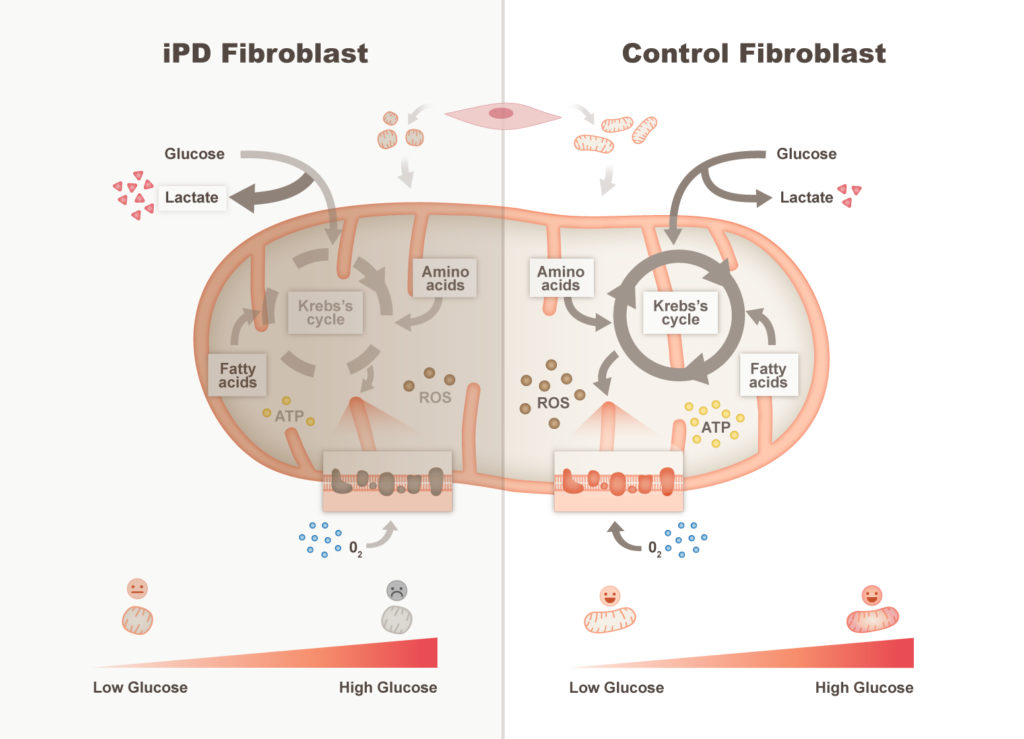
Mitochondrial alterations
Graphical abstract
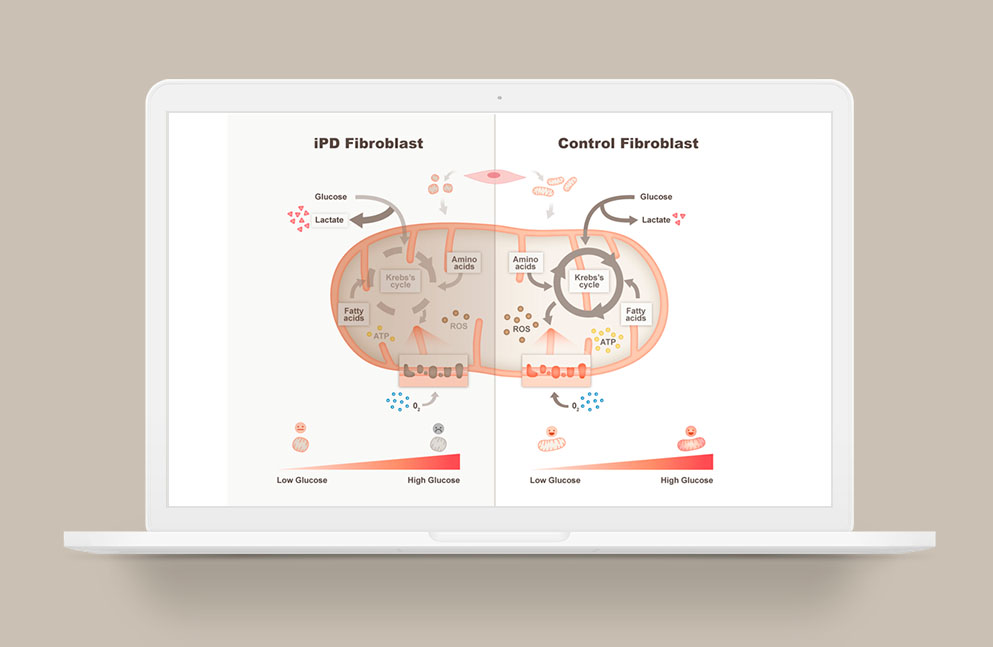
Graphical abstract describing the mitochondrial alterations observed in primary cultured fibroblasts from Idiopathic Parkinson’s disease patients. Published in Juárez-Flores, D.L. et al. Antioxidants. 2020.
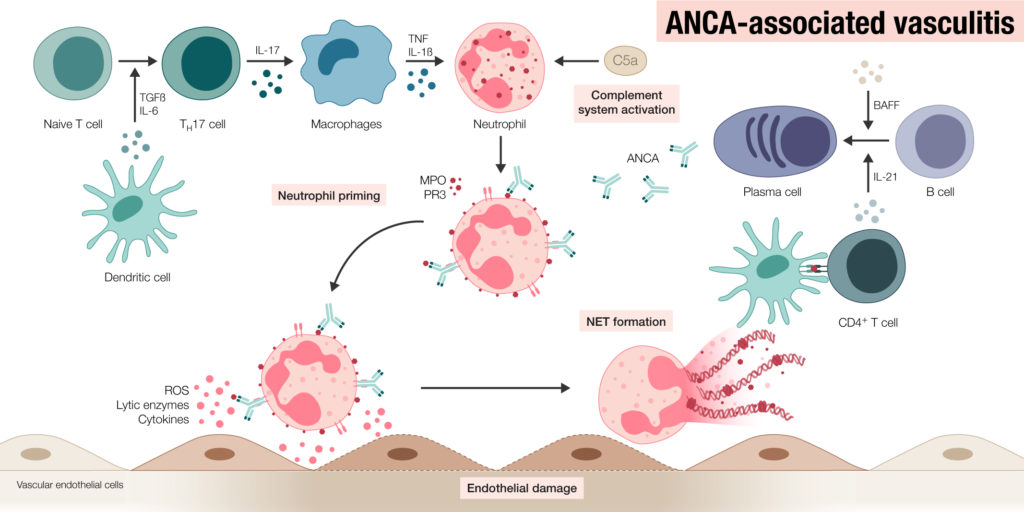
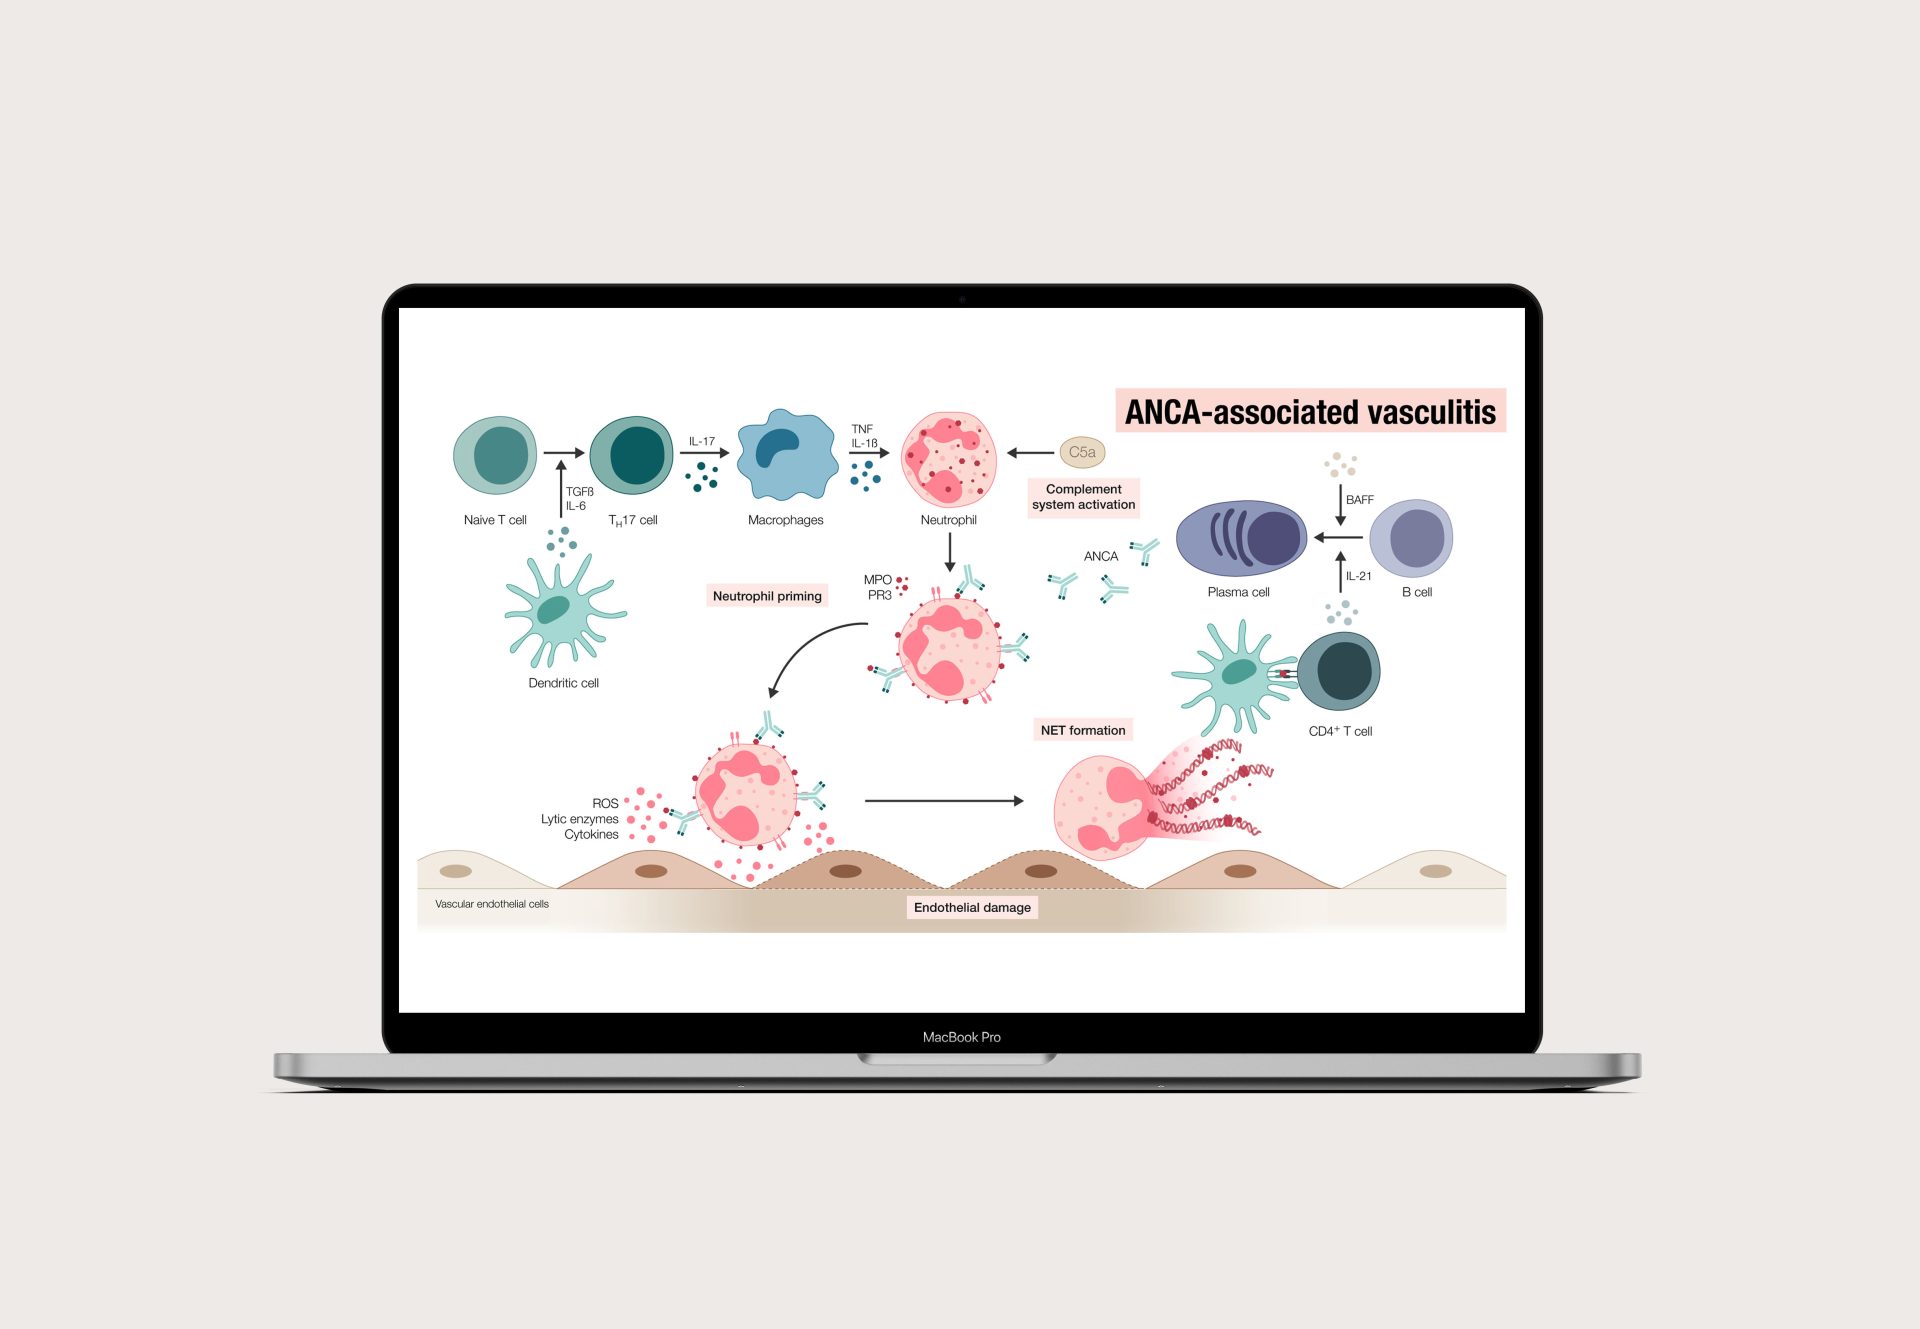
Pathogenesis of ANCA-associated vasculitis
Graphical abstract
Graphical abstract summarizing the pathogenesis of ANCA-associated vasculitis. Based on information from Nakazawa, D. et al. Nature Review Rheumatoly. 2019.
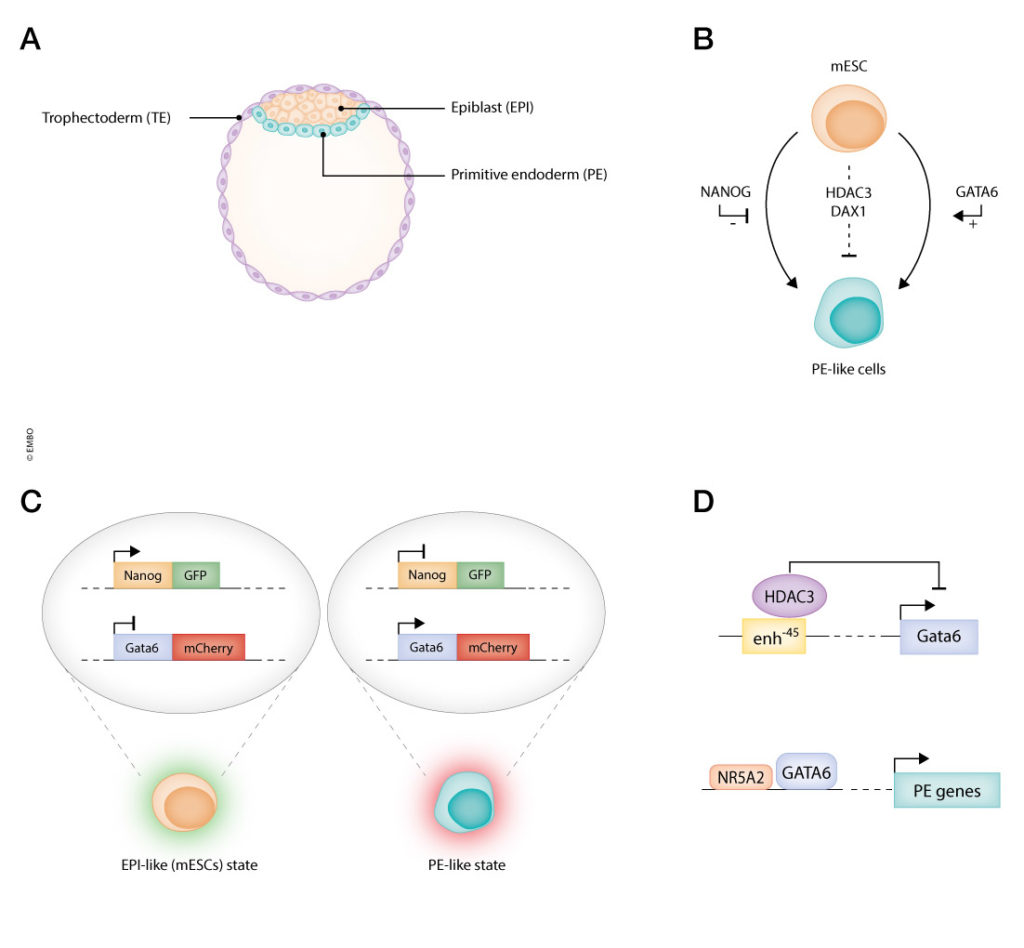
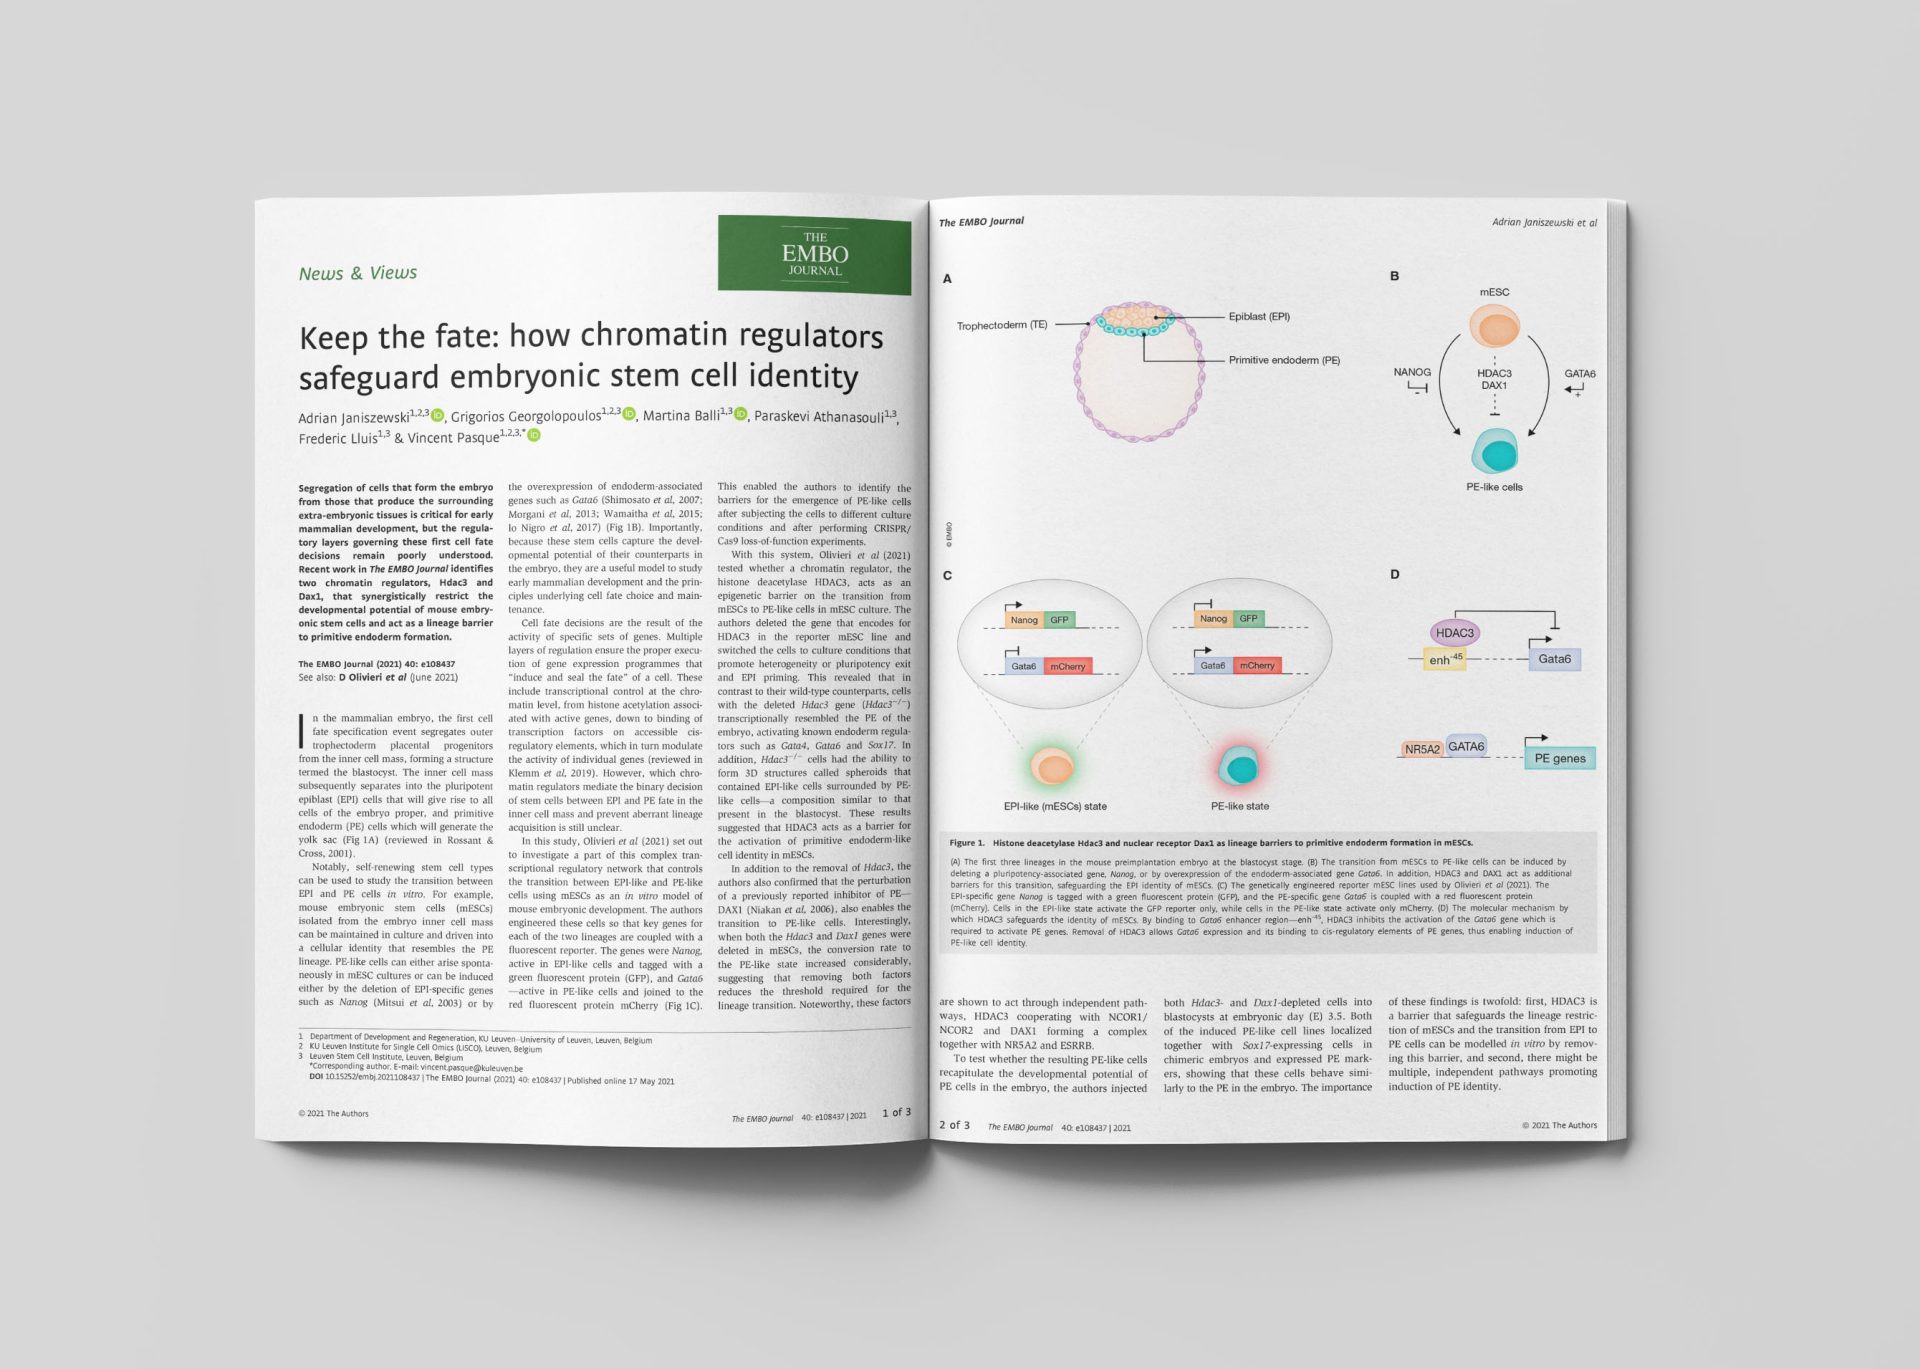
Chromatin regulators and mouse embryonic stem cells
Scientific illustration
Visuals are the perfect resource to illustrate methodological aspects of your research. This scientific illustration shows how histone deacetylase Hdac3 and nuclear receptor Dax1 act as lineage barriers to primitive endoderm formation in mouse embryonic stem cells. Illustration made for Somersault18:24 and published in Janiszewski A. et al. EMBO Journal. 2021.
Questions?
Interested in a scientific illustration? Just click the button or send an email at hi@catalyzingscience.com. We’ll be happy to help and answer all your questions.
