If we think about a research article’s abstract, we will provably envision a short paragraph in which the most important findings of the paper are depicted.
But, since a picture is worth a thousand words, why not to transform all those words into a single image?
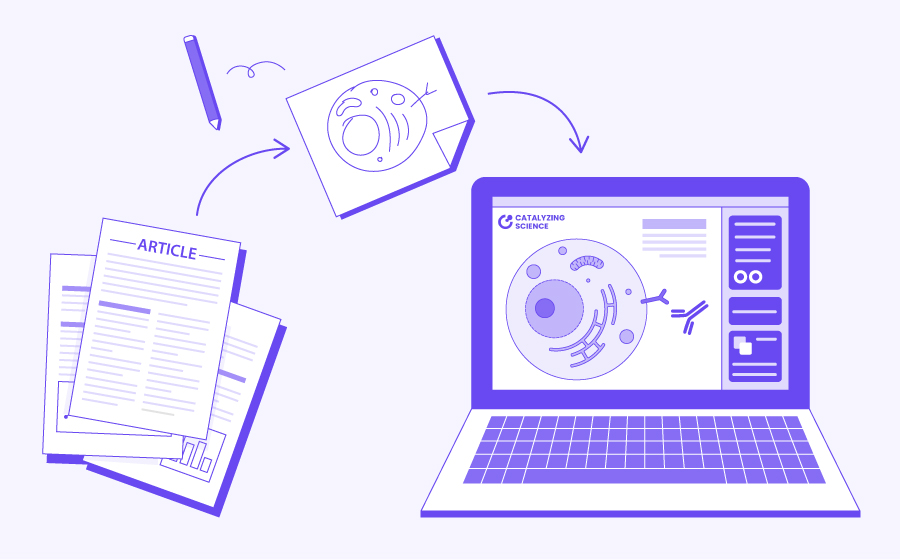
Yes, a graphical abstract is nothing else but a figure that visually summarizes the main message of your scientific story. These illustrated summaries need to be clear, attractive, and concise to help readers to quickly understand the main information of your work at a glance.
Since a graphical abstract is a visual representation of a scientific contribution, it should be specifically created with that purpose. It can’t be just a copy/paste of the best figure or diagram of the paper, or a collage made with some of them. An effective graphical abstract needs a narrative to tell your scientific story, to capture the main message of your work.
Graphical abstracts are becoming more and more popular in scientific research. Some journals often suggest its submission together with the paper, or even require it for publication. But this is not the main reason to create an engaging visual.
Reasons to create a graphical abstract:
After the hard research work and all those hours spent writing and compacting all the information into a scientific paper, you probably just want to publish it in a good journal as fast as you can. So, why should you spend more time and effort on creating a visual abstract?
Graphical abstracts are much more than nice embellishments, they are powerful tools for science communication. You may have the coolest story, but it will make no impact if you are not able to gather public attention, if it’s not communicated properly.
Here is where graphical abstracts can help. Let’s see 3 reasons why you should consider creating a graphical abstract for your scientific communications:
1. Graphical abstracts are worth a thousand words.
Let’s make a simple experiment. Can you read the following paragraph and check how long it takes?
The house is surrounded by green grass fields, full of red flowers. It has four windows on one of its sides and there is a large balcony on the main façade. To get to the house, there is a winding path to the front door, and you can see the smoke coming out of the chimney. There is also a large tree to the right of the house. The sun is shining in the sky and not a single cloud is visible, just some birds flying.
If we consider that the average reading speed is around 150 to 200 words a minute, to read that 86 words you probably spent, more or less, half a minute.
Take a moment now, how did you exactly imagine that house? And the tree? Where the windows close or open?

Let’s have a look at the illustration. How long it took to you to read the image? Did you already saw the image before the text? Is it similar to what you imagine after reading the description?
Images help us to convey information more effectively, and that is specially useful when we are trying to communicate complex scientific information. Compared to a written abstract, graphical abstracts are more time efficient, they allow us to express more ideas faster.
But visuals are not only faster to read, they are also more eye catching and appealing, so they are likely to grab readers’ attention before than descriptive text.
When we communicate something visually, we can give the reader a comprehensive idea of what we have in mind. For example, let’s imagine a chair: How does it look? Is it a desk chair? Is it brown, maybe black? The answer to all those questions will probably vary from person to person. However, if I show you a picture of a chair, you will receive all that information (and much more) immediately.
The same applies to graphical abstracts. With visuals, we are helping readers to understand better, quickly and more accurately what your scientific story is about.
2. Graphical abstracts are amazing promotional tools
Searching for information and reading articles are important tasks in the day-to-day life of researchers, but with the current flood of information, it’s hard to stay on top of the literature.
Like lighthouses indicating sailors the location of land, visual abstracts help scientists to find relevant content based on their research interest. If the content is valuable for them, they will provably end up reading the whole article and even citing it.
In this scenario, graphical abstracts work as visual ads of your research providing an overview of your work, hence can be really helpful to optimize the search process. Their goal is to draw readers’ attention and drive traffic to your paper.
Scientific journals use graphical abstracts as promotional tools, displaying them together with the tittle and list of authors, on the table-of-contents pages of the journal website and on their social media platforms. In addition, graphical abstracts, as classical abstracts, are usually free access even when the paper is behind a paywall.
Promotional advantages associated to graphical abstract are not limited to scientific journals’ websites, they can also be used to disseminate your work trough social media platforms such as Twitter or LinkedIn.
Since visual content performs better on these platforms, graphical abstracts are perfect to catch readers’ attention and make your scientific work stand out. When compared with the typical character tweet, tweets with images get 18% more clicks and 150% more retweets.
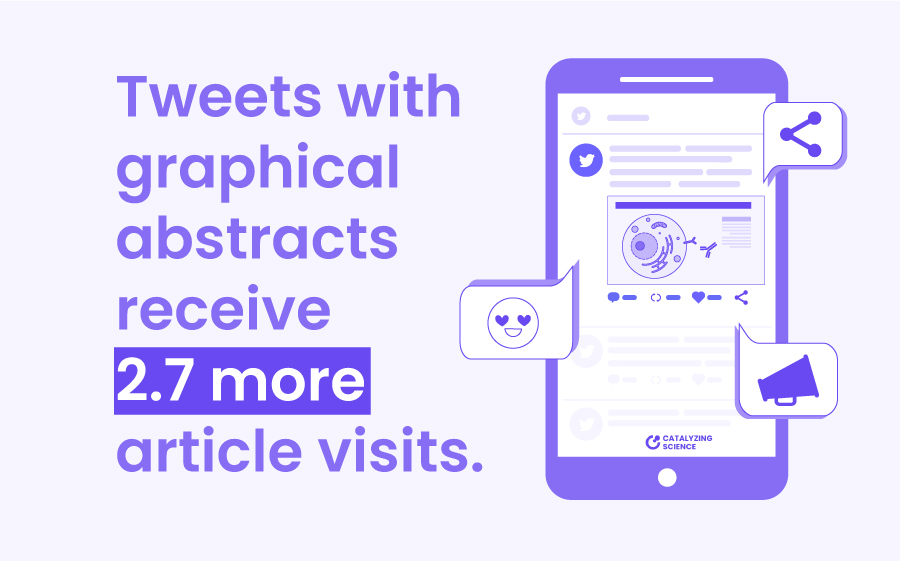
Going deeper into the numbers, in 2016 the scientific journal Annals of Surgery decided to use visual abstracts to promote new publications on Twitter. To compare the impact of tweets with or without visual abstracts, a study was conducted over one year. Researchers included 44 research articles and each one of them was tweeted in both formats, with a period of washout in between. Results showed that posts with visuals performed better than those without. Tweets with a graphical abstract received 2.7 more article visits, were retweeted 8.4 more times, and had a 7.7-fold increase in Twitter impressions.
Therefore, including a graphical abstract in your scientific story is a powerful promotion strategy. Visual abstracts increase the chance of your work to be seen and shared, contributing to its dissemination.
3. Graphical abstracts have multiple applications
Creating a visual abstract can be hard and time-consuming, specially if it’s the first time. On top of the typical used software being not so intuitive, there are a lot of design concepts that need to be taken into account to create something visually appealing and easily understandable.
These drawbacks may explain why some scientists decide not to spend time creating good visuals. However, and contrary to what you may think, creating a graphic summary can save you time in your future communication activities.
If your job is related with science, you will likely work in the same field for a while. Hence, once created, graphical abstracts are something that you will be able to use repeatedly, with just some small modification as your research progress. What’s more, all the individual elements and illustrations that compose the visual abstract can be reused in other figures and for other purposes. In addition, these advantages are not limited to one person, if you work in a team, all the members can also benefit of them.
Graphical abstracts are great beyond their applications in research articles. They are also perfect to ease the understanding of other type of scientific contributions and can be created in different formats depending on the media and target audience. Here are some examples where you could use a graphical abstract to improve your communications:
- Publication (original articles, reviews, …) of course
- Scientific posters
- Grant applications and research proposals
- Slide deck presentations (conferences, lab meetings, lectures, …)
- Research protocol outlines
- Thesis and books
- Lab or personal webpage
- Institutional website, newsletter, and social media platforms
- Media releases, magazines, and newspapers
- Patient educational materials
- Lectures and events for lay audiences
In summary, graphical abstracts are a powerful resource to communicate complex scientific information. They can be adapted to different audiences and platforms and enhance science dissemination. Far from being one more step required to publish your research, consider them as an opportunity to share your work and reach your audience.
Do you need a graphical abstract but don’t have the time to create one?
That’s one of our specialties! At Catalyzing Science we love the challenge of translating scientific ideas into engaging visuals.
You can check out the portfolio to see some of our previous work, and don’t hesitate to contact us to see how we can help you expand your science!